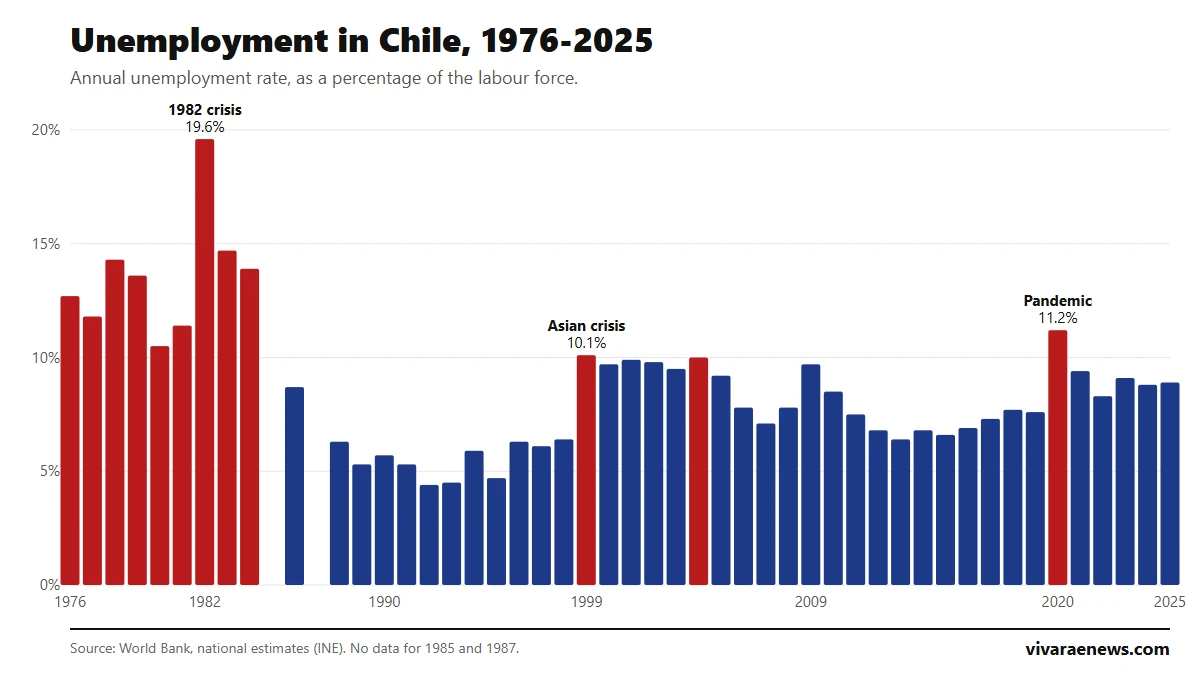
Over the last 50 years, annual unemployment in Chile has ranged from a peak of 19.6% in 1982 to a low of 4.4% in 1992, with an average of 8.8%. Today it is above that average: the latest figure from the national statistics institute (INE), for June-August 2026, was 9.6%, the highest in more than five years. This is the full ranking, using World Bank data.
The 10 years with the highest unemployment in Chile
| Rank | Year | Unemployment rate | Context |
|---|---|---|---|
| 1 | 1982 | 19.6% | Debt crisis |
| 2 | 1983 | 14.7% | Debt crisis |
| 3 | 1978 | 14.3% | |
| 4 | 1984 | 13.9% | Recovery from the crisis |
| 5 | 1979 | 13.6% | |
| 6 | 1976 | 12.7% | After the 1975 recession |
| 7 | 1977 | 11.8% | |
| 8 | 1981 | 11.4% | |
| 9 | 2020 | 11.2% | Pandemic |
| 10 | 1980 | 10.5% |
Nine of the ten worst years fall between 1976 and 1984. The only one from the 21st century is 2020, the year of the pandemic. The series is from the World Bank, based on the country's official figures, and has no data for 1985 or 1987.
Even higher figures circulate for the 1982 crisis, up to 26%, depending on what is measured and whether people in that era's emergency work programmes are counted as employed. We use a single source here so that the years are comparable with each other.
The 10 years with the lowest unemployment in Chile
| Rank | Year | Unemployment rate |
|---|---|---|
| 1 | 1992 | 4.4% |
| 2 | 1993 | 4.5% |
| 3 | 1995 | 4.7% |
| 4 | 1989 | 5.3% |
| 4 | 1991 | 5.3% |
| 6 | 1990 | 5.7% |
| 7 | 1994 | 5.9% |
| 8 | 1997 | 6.1% |
| 9 | 1988 | 6.3% |
| 9 | 1996 | 6.3% |
The ten best years are consecutive or nearly so: they run from 1988 to 1997, a period of strong economic growth. Since then, annual unemployment has never fallen below 6% again.
Unemployment in Chile by decade
| Period | Average | Years with data |
|---|---|---|
| 1976-1979 | 13.1% | 4 |
| 1980-1989 | 11.3% | 8 |
| 1990-1999 | 5.9% | 10 |
| 2000-2009 | 9.1% | 10 |
| 2010-2019 | 7.2% | 10 |
| 2020-2025 | 9.3% | 6 |
The current decade is, so far, the one with the highest unemployment since the 1980s.
Unemployment in Chile by government
| Government | Years counted | Average |
|---|---|---|
| Patricio Aylwin | 1990-1993 | 5.0% |
| Eduardo Frei Ruiz-Tagle | 1994-1999 | 6.6% |
| Michelle Bachelet (second term) | 2014-2017 | 6.9% |
| Sebastián Piñera (first term) | 2010-2013 | 7.3% |
| Michelle Bachelet (first term) | 2006-2009 | 8.1% |
| Gabriel Boric | 2022-2025 | 8.8% |
| Sebastián Piñera (second term) | 2018-2021 | 9.0% |
| Ricardo Lagos | 2000-2005 | 9.7% |
| Augusto Pinochet (from 1976) | 1976-1989 | 11.9% |
This is a simple calculation by calendar year, although terms change in March. It does not measure each government's performance: the average depends heavily on the external crises each one faced, such as the Asian crisis in the late 1990s, the 2009 financial crisis or the pandemic.
Unemployment under José Antonio Kast's government, as of October 2026
José Antonio Kast took office on 11 March 2026, so he does not yet have a full year to enter the table above. What can be tracked is the rate for each moving quarter published by INE since then:
| Moving quarter | Unemployment rate | Government |
|---|---|---|
| December 2025 - February 2026 | 8.3% | Last figure before the handover |
| January - March 2026 | 8.9% | Handover on 11 March |
| February - April 2026 | 9.1% | Kast |
| March - May 2026 | 9.4% | Kast |
| April - June 2026 | 9.4% | Kast |
| May - July 2026 | 9.5% | Kast |
| June - August 2026 | 9.6% | Kast |
Between the December-February quarter and the June-August one the rate rose 1.3 points, to 9.6%, with 989,400 people unemployed. The president himself spoke of a “structural” problem: when presenting his jobs plan he noted that the country had gone 43 consecutive months with unemployment above 8%, a streak that began before his term.
On 28 September the government launched the Chile Despega plan, which according to The Clinic involves mobilizing 1.3 trillion pesos in public works, investment and hiring subsidies, with the goal of creating more than 100,000 jobs between 2026 and 2027. There are two versions of the underlying target: his June state-of-the-nation address spoke of reaching 6%, and his ministers later committed to bringing unemployment down to 6.5% by the end of the term, according to Diario Financiero.
| Item | Figure |
|---|---|
| Rate on taking office (January-March 2026) | 8.9% |
| Latest rate (June-August 2026) | 9.6% |
| Target committed for the end of the term | Between 6% and 6.5%, depending on the version |
| Jobs promised by the Chile Despega plan | More than 100,000 |
Two caveats. These are quarterly figures and are not comparable with the annual averages of the other governments. And seven months is too short to assess an administration: employment reacts with a lag to economic decisions. The next figure, for July-September, is due at the end of October; the chief economist at Coopeuch, quoted in the press, projects it will be between 9.7% and 9.8%.
Where unemployment in Chile stands in 2026
| Indicator (June-August 2026) | Figure |
|---|---|
| National unemployment rate | 9.6% |
| Change over twelve months | +1.0 percentage point |
| Rate for women | 10.3% |
| Rate for men | 9.1% |
| Santiago Metropolitan Region | 9.8% |
| Rise in unemployed people in a year | 13.0% |
The data come from the National Statistics Institute. The rise is explained by more people looking for work while the number of people employed fell 0.9%. It is a quarterly figure, so it is not directly comparable with the annual averages in the tables above.
Why this ranking should be read with care
- The survey changed. INE overhauled its employment survey in 2010, with different definitions. Figures before and after do not measure exactly the same thing.
- Two years are missing. The series has no data for 1985 or 1987.
- The rate does not tell the whole story. It does not distinguish formal from informal work, nor does it reflect those who stopped looking.
To get a sense of the pay of those who do have state jobs, see how much a teacher earns in Chile and how much a police officer earns. And if you are interested in how foreign trade affects the economy, what a tariff is. The ranking series continues with inflation, GDP growth and the history of the minimum wage.
Frequently asked questions
What was Chile's highest unemployment in the last 50 years?
That of 1982: 19.6% as an annual average, according to the World Bank series.
What was the lowest?
That of 1992: 4.4%.
What is unemployment in Chile today?
9.6% in June-August 2026, according to INE.
What is the average of the last 50 years?
8.8%, across the 48 years with data between 1976 and 2025.