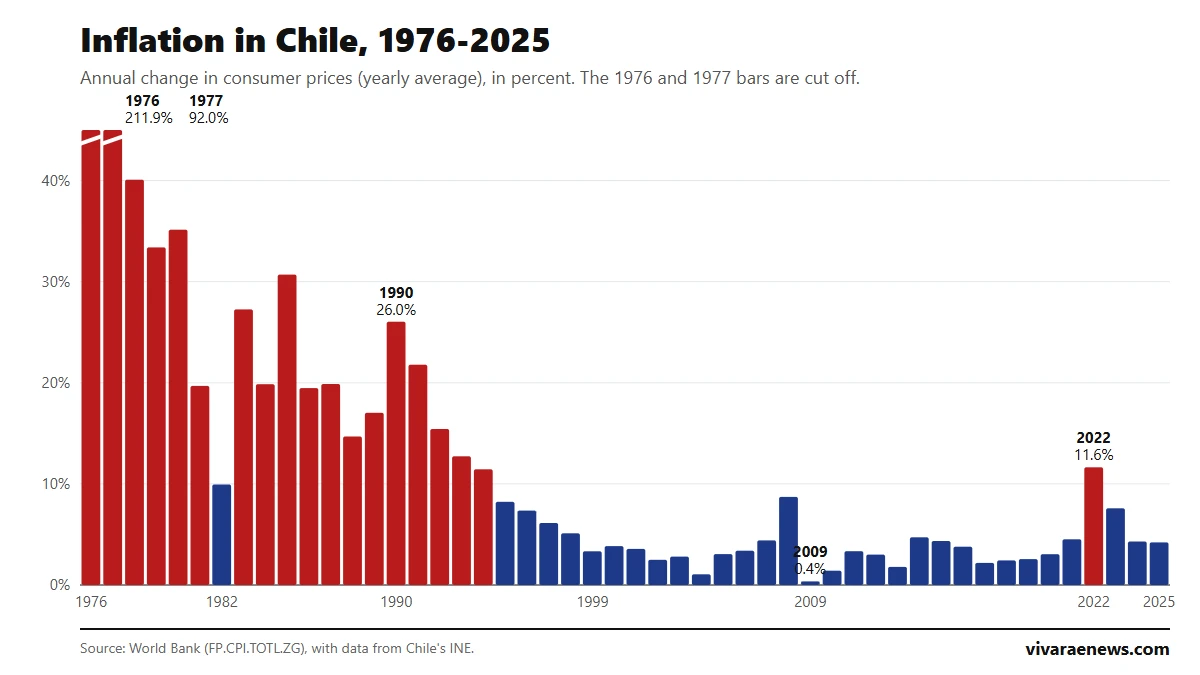
Over the last 50 years, annual inflation in Chile has ranged from 211.9% in 1976 to 0.4% in 2009. Since 1995 it has returned to double digits only once: in 2022, at 11.6%. Today it stands at 4.1% over twelve months, according to the September 2026 consumer price index, still above the Central Bank's 3% target. This is the full ranking, using World Bank data.
The 10 years with the highest inflation in Chile
| Rank | Year | Annual inflation | Context |
|---|---|---|---|
| 1 | 1976 | 211.9% | Coming down from the 1974 peak |
| 2 | 1977 | 92.0% | Coming down from the 1974 peak |
| 3 | 1978 | 40.1% | |
| 4 | 1980 | 35.1% | |
| 5 | 1979 | 33.4% | |
| 6 | 1985 | 30.7% | After the debt crisis |
| 7 | 1983 | 27.3% | After the debt crisis |
| 8 | 1990 | 26.0% | Return to democracy |
| 9 | 1991 | 21.8% | Return to democracy |
| 10 | 1987 | 19.9% |
The ten worst years all fall between 1976 and 1991. The series is the World Bank's, which measures how much the average price level of one year rose compared with the average of the previous year.
The ranking starts in 1976 because it covers 50 years, but the all-time peak came earlier: the same series records 352.8% in 1973, 504.7% in 1974 and 374.7% in 1975. By the time this ranking begins, inflation was already retreating.
The 10 years with the lowest inflation in Chile
| Rank | Year | Annual inflation | Context |
|---|---|---|---|
| 1 | 2009 | 0.4% | Global financial crisis |
| 2 | 2004 | 1.1% | |
| 3 | 2010 | 1.4% | |
| 4 | 2013 | 1.8% | |
| 5 | 2017 | 2.2% | |
| 6 | 2018 | 2.4% | |
| 7 | 2002 | 2.5% | |
| 8 | 2019 | 2.6% | |
| 9 | 2003 | 2.8% | |
| 10 | 2012 | 3.0% |
The ten lowest-inflation years all fall between 2002 and 2019. The lowest is 2009, in the middle of the global financial crisis, right after a 2008 in which prices had risen 8.7%.
Inflation in Chile by decade
| Period | Annual average |
|---|---|
| 1976-1979 | 94.3% |
| 1980-1989 | 21.4% |
| 1990-1999 | 11.8% |
| 2000-2009 | 3.4% |
| 2010-2019 | 3.0% |
| 2020-2025 | 5.9% |
The decline was gradual and took two decades. Between 1976 and 1994 inflation was in double digits every year except 1982 (9.9%). Since 1995 it has always been in single digits, with the sole exception of 2022. Two institutional changes go along with that path: the Central Bank's independence, in force since 1989, and the 3% inflation target in place since the early 2000s.
The simple average of the 50 years is 16.1%, but it is distorted by the first two: without 1976 and 1977 it drops to 10.5%. The median, the value that leaves half the years above and half below, is 5.6%. And in 24 of the 50 years inflation was below 5%.
Inflation in Chile by government
| Government | Years counted | Annual average |
|---|---|---|
| Sebastián Piñera (first term) | 2010-2013 | 2.4% |
| Ricardo Lagos | 2000-2005 | 2.8% |
| Sebastián Piñera (second term) | 2018-2021 | 3.1% |
| Michelle Bachelet (second term) | 2014-2017 | 3.8% |
| Michelle Bachelet (first term) | 2006-2009 | 4.2% |
| Gabriel Boric | 2022-2025 | 6.9% |
| Eduardo Frei Ruiz-Tagle | 1994-1999 | 6.9% |
| Patricio Aylwin | 1990-1993 | 19.0% |
| Augusto Pinochet (from 1976) | 1976-1989 | 42.2% |
This is a simple calculation by calendar year, even though terms change in March. It does not measure each government's performance: since 1989 monetary policy has been run by the Central Bank, which is independent, and prices depend heavily on external factors, such as oil in 2008 or the worldwide surge after the pandemic in 2022.
Where inflation stands in Chile in 2026
| Indicator | Figure |
|---|---|
| September 2026 CPI, monthly change | 0.4% |
| Inflation accumulated in the year | 4.0% |
| Twelve-month inflation | 4.1% |
| Central Bank target | 3% |
| Central Bank forecast for the end of 2026 | Somewhat above 4% |
| Monetary policy rate | 4.5% |
The national statistics institute (INE) published the figure on 8 October. In September, eight of the thirteen divisions of the basket rose; the ones that weighed most were food and non-alcoholic beverages (0.6%) and transport (0.9%), with a 10.2% rise in diesel, according to the breakdown reported by The Clinic.
In its September Monetary Policy Report, the Central Bank forecast that inflation will end 2026 somewhat above 4% and converge to the 3% target in the second quarter of 2027, according to Radio Universidad de Chile. The report attributes the pressure to higher fuel prices amid the conflict in the Middle East.
Why this ranking should be read with care
- Annual average, not December to December. The figure most often quoted in Chile is the twelve-month change in the CPI as of December. That is why 2022 appears here at 11.6% and not at the 12.8% with which that year closed.
- The basket changes. The INE periodically updates the products and weights of the CPI; old and recent figures do not measure exactly the same basket.
- The 50-year average says little. Two years of triple-digit inflation drag it up; the median describes a typical year better.
Inflation defines the next adjustment of the minimum wage in Chile, which in January 2027 rises in line with the CPI. To complete the picture, see the unemployment ranking and the ranking of Chile's GDP growth.
Frequently asked questions
What has been the highest inflation in Chile in the last 50 years?
That of 1976: 211.9% as an annual average, according to the World Bank series. The all-time peak came earlier: 504.7% in 1974.
What has been the lowest?
That of 2009: 0.4%.
What is inflation in Chile today?
4.1% over twelve months and 4.0% accumulated in the year, according to the INE's September 2026 CPI.
What is Chile's inflation target?
3% a year. The Central Bank expects to return to that level in the second quarter of 2027.