
Over the last 50 years, Chile's GDP grew by an average of 4.4% a year, with a peak of 11.5% in 1992 and a contraction of 11.5% in 1982. The pace has been fading: since 2014 the average is 2.1%, and for 2026 the Central Bank forecasts between 0.25% and 0.75%. This is the full ranking, using World Bank data.
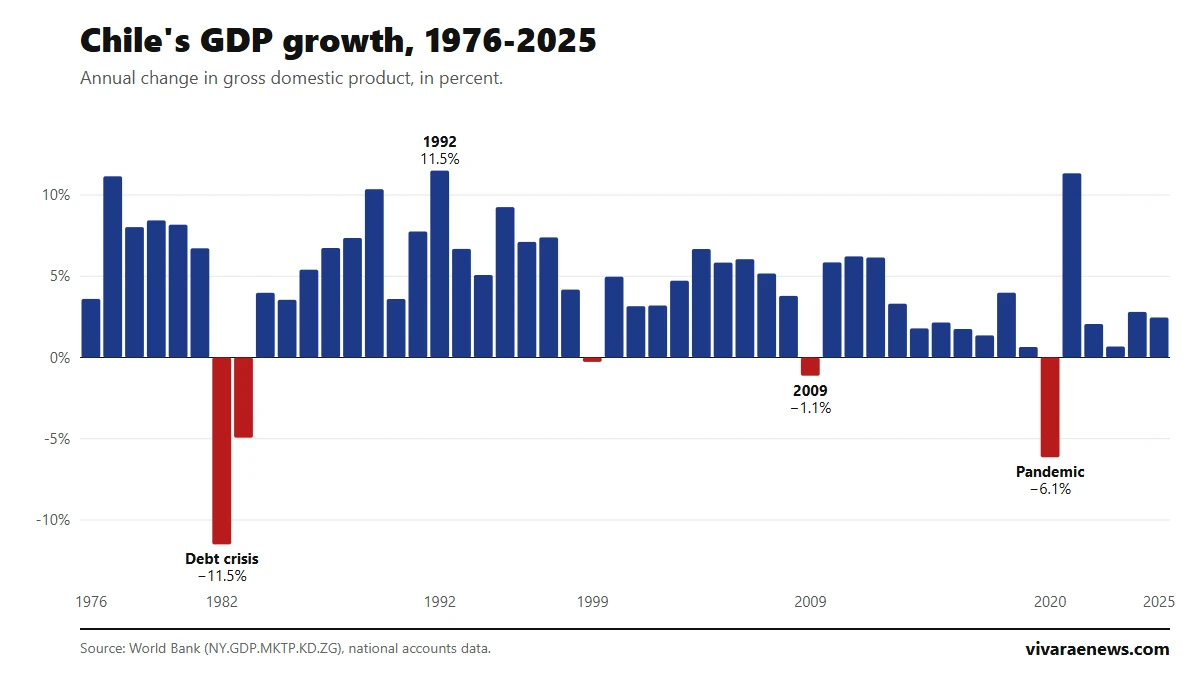
The 10 years in which Chile's economy grew the most
| Rank | Year | GDP growth | Context |
|---|---|---|---|
| 1 | 1992 | 11.5% | |
| 2 | 2021 | 11.3% | Post-pandemic rebound |
| 3 | 1977 | 11.1% | Recovery from the 1975 recession |
| 4 | 1989 | 10.4% | |
| 5 | 1995 | 9.3% | |
| 6 | 1979 | 8.4% | |
| 7 | 1980 | 8.2% | |
| 8 | 1978 | 8.0% | |
| 9 | 1991 | 7.8% | |
| 10 | 1997 | 7.4% |
Nine of the ten best years fall between 1977 and 1997. The only later one is 2021, and there is an explanation: it was the rebound after the pandemic slump. The series is the World Bank's, which measures the change in GDP after stripping out inflation.
The late-1970s years are partly a rebound too: the ranking starts in 1976, right after a recession that made GDP fall 12.3% in 1975, according to the same series.
The 10 worst years for Chile's GDP
| Rank | Year | GDP growth | Context |
|---|---|---|---|
| 1 | 1982 | −11.5% | Debt crisis |
| 2 | 2020 | −6.1% | Pandemic |
| 3 | 1983 | −4.9% | Debt crisis |
| 4 | 2009 | −1.1% | Global financial crisis |
| 5 | 1999 | −0.3% | Asian crisis |
| 6 | 2019 | 0.6% | October social unrest |
| 7 | 2023 | 0.7% | |
| 8 | 2017 | 1.4% | |
| 9 | 2016 | 1.8% | |
| 10 | 2014 | 1.8% |
In half a century Chile's economy contracted only five times: 1982, 1983, 1999, 2009 and 2020. The other five on the list are years of low growth, all between 2014 and 2023.
Chile's growth by decade
| Period | Average annual growth |
|---|---|
| 1976-1979 | 7.8% |
| 1980-1989 | 3.6% |
| 1990-1999 | 6.2% |
| 2000-2009 | 4.2% |
| 2010-2019 | 3.3% |
| 2020-2025 | 2.2% |
The most dynamic stretch ran from 1986 to 1997, twelve straight years averaging 7.4%. In all, the economy grew by more than 5% in 24 of the 50 years, but since 2014 only one year has exceeded 4%: 2021.
Chile's growth by government
| Government | Years counted | Average annual growth |
|---|---|---|
| Patricio Aylwin | 1990-1993 | 7.4% |
| Eduardo Frei Ruiz-Tagle | 1994-1999 | 5.5% |
| Sebastián Piñera (first term) | 2010-2013 | 5.4% |
| Augusto Pinochet (from 1976) | 1976-1989 | 4.8% |
| Ricardo Lagos | 2000-2005 | 4.8% |
| Michelle Bachelet (first term) | 2006-2009 | 3.5% |
| Sebastián Piñera (second term) | 2018-2021 | 2.5% |
| Gabriel Boric | 2022-2025 | 2.0% |
| Michelle Bachelet (second term) | 2014-2017 | 1.8% |
This is a simple calculation by calendar year, even though terms change in March. It does not measure each government's performance: the average depends on the copper price, on external crises and on where each cycle falls. Piñera's second term, for example, includes the largest fall since 1982 (2020) and the second-highest growth in the series (2021).
Chile's GDP per capita, 1976 to 2025
| Year | In current US dollars | In constant 2015 US dollars | At purchasing power parity |
|---|---|---|---|
| 1976 | US$971 | US$3,489 | — |
| 1980 | US$2,571 | US$4,627 | — |
| 1990 | US$2,488 | US$5,291 | US$4,444 |
| 2000 | US$5,053 | US$8,465 | US$9,376 |
| 2010 | US$12,633 | US$11,649 | US$17,918 |
| 2020 | US$13,118 | US$12,681 | US$25,357 |
| 2025 | US$17,995 | US$14,905 | US$37,774 |
In 2025 Chile's GDP per capita was US$17,995 in current dollars and US$37,774 when adjusted for purchasing power. After stripping out inflation, which is the column to use for comparisons over time, income per person has multiplied by 4.3 since 1976 and by 2.8 since 1990.
The recent slowdown shows up here as well: between 2013 and 2025 real GDP per capita rose 13% in total, less than it managed in two years in the early 1990s. Purchasing power parity figures are only available from 1990.
How much Chile will grow in 2026
| Central Bank forecast (September 2026 Monetary Policy Report) | Range |
|---|---|
| GDP growth in 2026 | 0.25% to 0.75% |
| Previous forecast for 2026 (June) | 1% to 1.75% |
| GDP growth in 2027 | 2% to 3% |
| GDP growth in 2028 | 2.25% to 3.25% |
The Central Bank cut its forecast in the Monetary Policy Report of 9 September, according to Radio Universidad de Chile. The reasons given in the report: supply problems in the first quarter, weak demand and a weak labour market in the second, with higher fuel prices in the background, and bad weather in the third. The 2027 rebound is conditional on approval of the economic reform the government has before Congress, which according to the report would give investment a stronger push.
If the year ends within that range, 2026 would rank among the eight worst in the series, on a par with 2019 (0.6%) and 2023 (0.7%).
Why this ranking should be read with care
- Figures get revised. National accounts are corrected and rebased; recent data can move by a few tenths.
- The starting point matters. Growing 11% after a slump is not the same as growing 11% from a normal year: 1977 and 2021 are rebounds.
- GDP is not well-being. It says nothing about how income is distributed or how much reaches households.
Low growth shows up in jobs: see the ranking of unemployment in Chile. It also shows in prices and wages, with the inflation ranking and the history of the minimum wage.
Frequently asked questions
What has been Chile's best year for growth in the last 50 years?
1992, at 11.5%, according to the World Bank series. It is followed by 2021 (11.3%) and 1977 (11.1%).
What has been the worst fall?
That of 1982: −11.5%, during the debt crisis. The second is 2020, at −6.1%.
What is Chile's GDP per capita?
US$17,995 in 2025 in current dollars, and US$37,774 at purchasing power parity, according to the World Bank.
How much will Chile grow in 2026?
Between 0.25% and 0.75%, according to the Central Bank's September 2026 forecast.