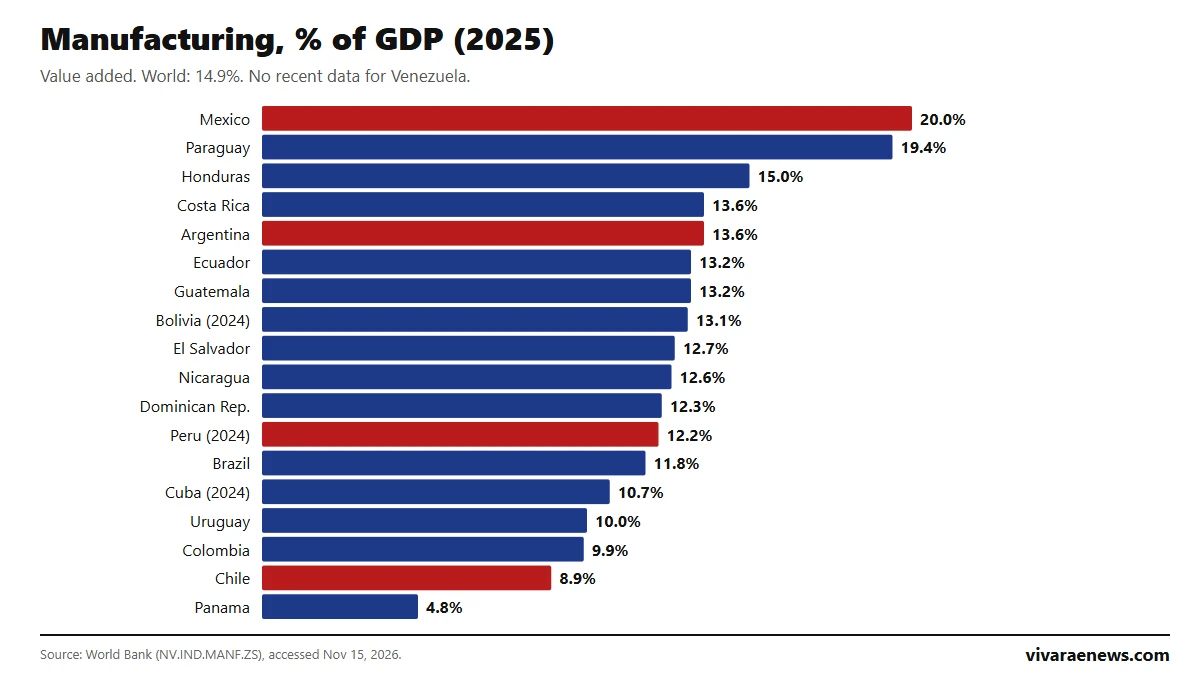
Mexico is the most industrial country in Latin America: manufacturing contributed 20.0% of its GDP in 2025, according to the World Bank. It is followed by Paraguay (19.4%), Honduras (15.0%) and Costa Rica (13.6%). Argentina has 13.6%, Peru 12.2% and Brazil 11.8%. Chile, at 8.9%, ranks 17 of 18, and only Panama (4.8%) has a smaller industry relative to its economy. The world average is 14.9%.
Manufacturing turns raw materials into products: cars, processed food, chemicals, textiles, machinery or electronics. It does not include mining or construction. This ranking of manufacturing in Latin America compares its weight in GDP and its value in dollars, and is updated on this same page when the World Bank publishes new data.
View the data as a table
| Mexico | 20.0% |
| Chile | 8.9% |
| World average | 14.9% |
| Mexico, in dollars | US$ 366 B |
Ranking of manufacturing in Latin America
| Rank | Country | % of GDP | Value (US$ million) | Year | % of GDP in 2000 |
|---|---|---|---|---|---|
| 1 | Mexico | 20.0 | 366,083 | 2025 | 21.0 |
| 2 | Paraguay | 19.4 | 9,573 | 2025 | 15.7 |
| 3 | Honduras | 15.0 | 5,929 | 2025 | 20.5 |
| 4 | Costa Rica | 13.6 | 13,972 | 2025 | 18.1 |
| 5 | Argentina | 13.6 | 92,790 | 2025 | 16.5 |
| 6 | Ecuador | 13.2 | 17,249 | 2025 | 23.9 |
| 7 | Guatemala | 13.2 | 16,270 | 2025 | 13.2 |
| 8 | Bolivia | 13.1 | 7,171 | 2024 | 13.2 |
| 9 | El Salvador | 12.7 | 4,652 | 2025 | 19.5 |
| 10 | Nicaragua | 12.6 | 2,799 | 2025 | 12.5 |
| 11 | Dominican Rep. | 12.3 | 15,626 | 2025 | 21.0 |
| 12 | Peru | 12.2 | 35,714 | 2024 | 15.2 |
| 13 | Brazil | 11.8 | 268,398 | 2025 | 13.1 |
| 14 | Cuba | 10.7 | - | 2024 | 16.4 |
| 15 | Uruguay | 10.0 | 8,498 | 2025 | 12.5 |
| 16 | Colombia | 9.9 | 45,262 | 2025 | 13.9 |
| 17 | Chile | 8.9 | 31,997 | 2025 | 15.2 |
| 18 | Panama | 4.8 | 4,339 | 2025 | 9.8 |
Source: World Bank, indicator NV.IND.MANF.ZS (manufacturing value added, % of GDP), accessed November 15, 2026; value in current dollars, indicator NV.IND.MANF.CD. 2025 data; Bolivia, Cuba and Peru, 2024. Venezuela has no recent data. Cuba does not report the dollar value. World Bank figures may differ from each country's national accounts due to revisions and methodological differences.
View the data as a table
| Mexico | 20.0% |
| Paraguay | 19.4% |
| Honduras | 15.0% |
| Costa Rica | 13.6% |
| Argentina | 13.6% |
| Ecuador | 13.2% |
| Guatemala | 13.2% |
| Bolivia | 13.1% |
| El Salvador | 12.7% |
| Nicaragua | 12.6% |
| Dominican Republic | 12.3% |
| Peru | 12.2% |
| Brazil | 11.8% |
| Cuba | 10.7% |
| Uruguay | 10.0% |
| Colombia | 9.9% |
| Chile | 8.9% |
| Panama | 4.8% |
How much each country's manufacturing produces in dollars
In absolute terms, Mexico and Brazil account for most of the region's manufacturing. Mexico generated US$ 366,083 million in manufacturing value added in 2025 and Brazil US$ 268,398 million; together they make up 67% of the total for countries with data. Argentina, with US$ 92,790 million, is third, followed by Colombia (US$ 45,262 million), Peru (US$ 35,714 million, 2024 data) and Chile (US$ 31,997 million).
| Country | Value added (US$ million) | Share of total with data |
|---|---|---|
| Mexico | 366,083 | 38.7% |
| Brazil | 268,398 | 28.4% |
| Argentina | 92,790 | 9.8% |
| Colombia | 45,262 | 4.8% |
| Peru | 35,714 | 3.8% |
| Chile | 31,997 | 3.4% |
| Ecuador | 17,249 | 1.8% |
| Guatemala | 16,270 | 1.7% |
Mexico's weight is explained by its integration with the United States, which buys most of its cars, auto parts and electronics; that is why threats of new tariffs hit its industry above all. In Chile, by contrast, the economy revolves around mining, which the World Bank counts separately, and manufacturing is concentrated in food, beverages, pulp and chemicals.
Latin America's deindustrialization since 1991
Almost every country in the region today has a smaller industry relative to GDP than 30 years ago. Chile went from 18.9% in 1991 to 8.9% in 2025 and Argentina from 24.4% to 13.6%. Brazil fell from 21.8% to 11.8% and Uruguay from 28.3% to 10.0%, the biggest drop in the region. Mexico is the big exception: it has stayed near 20% since the 1990s, supported by exports to the United States; Paraguay and Cuba also rose. Economists call this "premature deindustrialization", because it happened before countries reached high incomes.
View the data as a table
| Mexico | Argentina | Brazil | Peru | Colombia | Chile | |
|---|---|---|---|---|---|---|
| 1991 | 18.9% | 24.4% | 21.8% | 16.1% | 17.9% | 18.9% |
| 2000 | 21.0% | 16.5% | 13.1% | 15.2% | 13.9% | 15.2% |
| 2005 | 18.1% | 18.3% | 14.7% | 16.6% | 16.0% | 12.8% |
| 2010 | 17.8% | 15.8% | 12.7% | 15.6% | 14.0% | 9.9% |
| 2015 | 19.8% | 14.2% | 10.5% | 13.8% | 12.4% | 10.4% |
| 2020 | 20.2% | 14.6% | 10.7% | 12.3% | 10.7% | 9.0% |
| 2025 | 20.0% | 13.6% | 11.8% | No data | 9.9% | 8.9% |
| Country | 1991 | 2000 | 2005 | 2010 | 2015 | 2020 | 2025 |
|---|---|---|---|---|---|---|---|
| Mexico | 18.9 | 21.0 | 18.1 | 17.8 | 19.8 | 20.2 | 20.0 |
| Argentina | 24.4 | 16.5 | 18.3 | 15.8 | 14.2 | 14.6 | 13.6 |
| Brazil | 21.8 | 13.1 | 14.7 | 12.7 | 10.5 | 10.7 | 11.8 |
| Peru | 16.1 | 15.2 | 16.6 | 15.6 | 13.8 | 12.3 | - |
| Colombia | 17.9 | 13.9 | 16.0 | 14.0 | 12.4 | 10.7 | 9.9 |
| Chile | 18.9 | 15.2 | 12.8 | 9.9 | 10.4 | 9.0 | 8.9 |
Source: World Bank, indicator NV.IND.MANF.ZS (manufacturing value added, % of GDP), accessed November 15, 2026. Peru has no 2025 data. For other dimensions of regional trade and industry, see the rankings of high-tech exports, exports to the United States and foreign direct investment.
Frequently asked questions
Which is the most industrialized country in Latin America?
Mexico, both by the weight of manufacturing in its GDP (20.0% in 2025) and by its dollar value (US$ 366,083 million).
How large is manufacturing in Chile?
8.9% of GDP in 2025, US$ 31,997 million, according to the World Bank. It is the second-lowest in the region, after Panama.
Does mining count as manufacturing?
No. The World Bank indicator measures only manufacturing; mining, energy and construction are counted separately.
How often is this ranking updated?
When the World Bank publishes new annual data. It is updated at this same URL.
How to cite this data
Vivarae News (2026). "Manufacturing in Latin America: ranking by country 2026". Updated November 15, 2026. Available at https://vivaraenews.com/en/manufacturing-in-latin-america-ranking-by-country-2026/. The data may be reproduced by citing Vivarae News and linking to this page; each country's figures come from the World Bank.