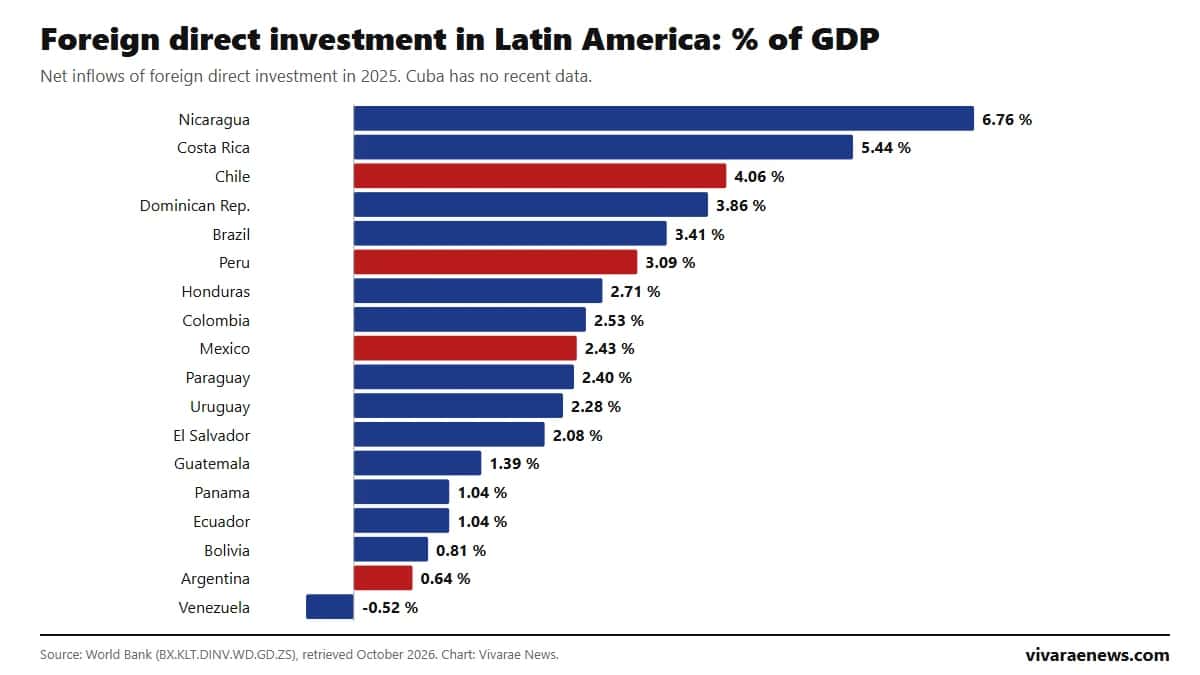
Nicaragua is the Latin American country that receives the most foreign direct investment relative to the size of its economy: 6.76% of GDP in 2025, according to World Bank data retrieved in October 2026. It is followed by Costa Rica (5.44%) and Chile (4.06%). In dollar terms, Brazil comes first with US$77,676 million, followed by Mexico (US$44,582 million) and Chile (US$14,513 million).
At the other end, Venezuela recorded negative net inflows (−0.52% of GDP), meaning divestments exceeded the investment that came in, and Argentina fell to 0.64%, the lowest level among countries with a positive figure. The Latin America and Caribbean average was 2.78% of GDP, twice the world average (1.42%). This ranking will be updated on this same page when the World Bank publishes new data.
Ranking of foreign direct investment in Latin America
| Rank | Country | Net FDI, % of GDP (2025) | US$ million (2025) | % of GDP in 2024 |
|---|---|---|---|---|
| 1 | Nicaragua | 6.76% | 1,503 | 6.87% |
| 2 | Costa Rica | 5.44% | 5,597 | 5.59% |
| 3 | Chile | 4.06% | 14,513 | 3.98% |
| 4 | Dominican Republic | 3.86% | 4,919 | 3.60% |
| 5 | Brazil | 3.41% | 77,676 | 3.39% |
| 6 | Peru | 3.09% | 10,353 | 2.30% |
| 7 | Honduras | 2.71% | 1,073 | 1.79% |
| 8 | Colombia | 2.53% | 11,571 | 3.25% |
| 9 | Mexico | 2.43% | 44,582 | 2.49% |
| 10 | Paraguay | 2.40% | 1,180 | 2.45% |
| 11 | Uruguay | 2.28% | 1,945 | −4.79% |
| 12 | El Salvador | 2.08% | 764 | 3.01% |
| 13 | Guatemala | 1.39% | 1,714 | 1.65% |
| 14 | Panama | 1.04% | 938 | 2.41% |
| 15 | Ecuador | 1.04% | 1,349 | 0.37% |
| 16 | Bolivia | 0.81% | 527 | 0.65% |
| 17 | Argentina | 0.64% | 4,362 | 1.94% |
| 18 | Venezuela | −0.52% | −522 | −2.11% |
| — | Cuba | No recent data | 79 | — |
Source: World Bank, indicator BX.KLT.DINV.WD.GD.ZS (% of GDP) and BX.KLT.DINV.CD.WD (current dollars), net inflows from the balance of payments. Panama and Ecuador tie after rounding; Panama ranks higher with 1.037% against 1.035%. Cuba has not reported investment relative to GDP since 2020.
Foreign direct investment (FDI) is money that companies from other countries put into a country to gain control of, or a lasting stake in, a business: buying a local company, building a plant, opening a subsidiary or reinvesting the profits of one that already operates there. "Net inflows" subtract divestments in the same year, which is why they can be negative.
The Latin American countries that receive the most foreign investment in dollars
Measured in dollars, foreign direct investment in Latin America is highly concentrated. Brazil and Mexico together receive US$122,258 million, about two thirds of what the 19 countries in the ranking receive combined (some US$184.1 billion, our own calculation based on World Bank data).
| Rank | Country | Net FDI 2025 (US$ million) | Share of the 19 countries |
|---|---|---|---|
| 1 | Brazil | 77,676 | 42% |
| 2 | Mexico | 44,582 | 24% |
| 3 | Chile | 14,513 | 8% |
| 4 | Colombia | 11,571 | 6% |
| 5 | Peru | 10,353 | 6% |
| 6 | Costa Rica | 5,597 | 3% |
| 7 | Dominican Republic | 4,919 | 3% |
| 8 | Argentina | 4,362 | 2% |
| 9 | Uruguay | 1,945 | 1% |
| 10 | Guatemala | 1,714 | 1% |
Source: World Bank, BX.KLT.DINV.CD.WD; shares are our own calculation over the sum of the 19 countries. To compare the size of each economy, see the ranking of GDP per capita in Latin America.

How foreign direct investment in Latin America has changed since 2021
| Country | 2021 | 2022 | 2023 | 2024 | 2025 |
|---|---|---|---|---|---|
| Brazil | 2.78% | 3.87% | 2.86% | 3.39% | 3.41% |
| Mexico | 2.71% | 2.67% | 1.71% | 2.49% | 2.43% |
| Chile | 4.81% | 6.23% | 5.72% | 3.98% | 4.06% |
| Colombia | 3.00% | 4.97% | 4.58% | 3.25% | 2.53% |
| Peru | 3.15% | 4.63% | 1.64% | 2.30% | 3.09% |
| Argentina | 1.37% | 2.40% | 4.04% | 1.94% | 0.64% |
| Uruguay | 8.50% | 12.37% | −6.63% | −4.79% | 2.28% |
Source: World Bank, net FDI inflows as % of GDP. Three trends stand out:
- Chile received 6.23% of GDP in 2022 and fell to about 4% in 2024 and 2025, although it remains on the regional podium.
- Argentina went from 4.04% in 2023 to 0.64% in 2025: in dollars, from US$26,267 million to US$4,362 million, according to the World Bank series.
- Uruguay had negative net inflows in 2023 and 2024 and returned to positive territory in 2025 (2.28%). Net figures can swing sharply because of large operations by a single company, so any single year should be read with caution.
- Peru recovered from 1.64% in 2023 to 3.09% in 2025.
Panama's drop, from 3.26% in 2023 to 1.04% in 2025, coincides with the closure of the Cobre Panamá mine at the end of 2023, although the World Bank does not detail the causes country by country.
What ECLAC says about investment in the region
The Economic Commission for Latin America and the Caribbean (ECLAC), which publishes its own annual foreign investment report, calculated that the region received US$194,233 million in 2025, just 1.7% more than in 2024, according to the summary distributed by EFE on June 23, 2026.
| ECLAC figure (2025) | Value |
|---|---|
| FDI received by Latin America and the Caribbean | US$194,233 million (+1.7%) |
| Share of regional GDP | 2.8% |
| Share of gross fixed capital formation | 14% |
| Main recipients | Brazil 40%, Mexico 22%, Chile 7%, Peru and Colombia 6% each |
| Main origin | United States 35%, Europe 32% |
| Destination by sector | Services 53%, manufacturing 31%, natural resources 16% |
Source: ECLAC, via EFE. ECLAC and World Bank figures do not match exactly: each organization uses its own sources and coverage (ECLAC includes Caribbean countries such as Guyana, which received 5% of the total, and the World Bank aggregate adds other Caribbean economies). What does match is the order of the main recipients: Brazil, Mexico and Chile.
Foreign investment also depends on the cost of money and each country's risk. For that context, see interest rates in Latin America, public debt by country and the economic growth projected by the IMF.
How to cite this data
Vivarae News (2026). "Foreign direct investment in Latin America 2026: ranking by country according to the World Bank". Updated on October 30, 2026. Available at https://vivaraenews.com/en/foreign-direct-investment-in-latin-america-ranking-by-country-2026/. The data may be reproduced by citing Vivarae News and linking to this page; each country's figures belong to the World Bank and ECLAC.
Frequently asked questions
Which Latin American country receives the most foreign direct investment?
In dollars, Brazil, with US$77,676 million in 2025. Relative to the size of its economy, Nicaragua, with 6.76% of GDP, according to the World Bank.
How much foreign investment does Chile receive?
US$14,513 million in 2025, equivalent to 4.06% of GDP, third in the region on both measures.
How much foreign investment does Mexico receive?
US$44,582 million in 2025, 2.43% of GDP. It is the second-largest recipient in Latin America in dollars.
Why is Venezuela's foreign investment negative?
Because divestments and withdrawals of foreign capital exceeded new inflows: −US$522 million in 2025.
How much foreign investment did Latin America receive in 2025?
US$194,233 million according to ECLAC, 1.7% more than in 2024. The World Bank, with different coverage, gives a higher figure for Latin America and the Caribbean.