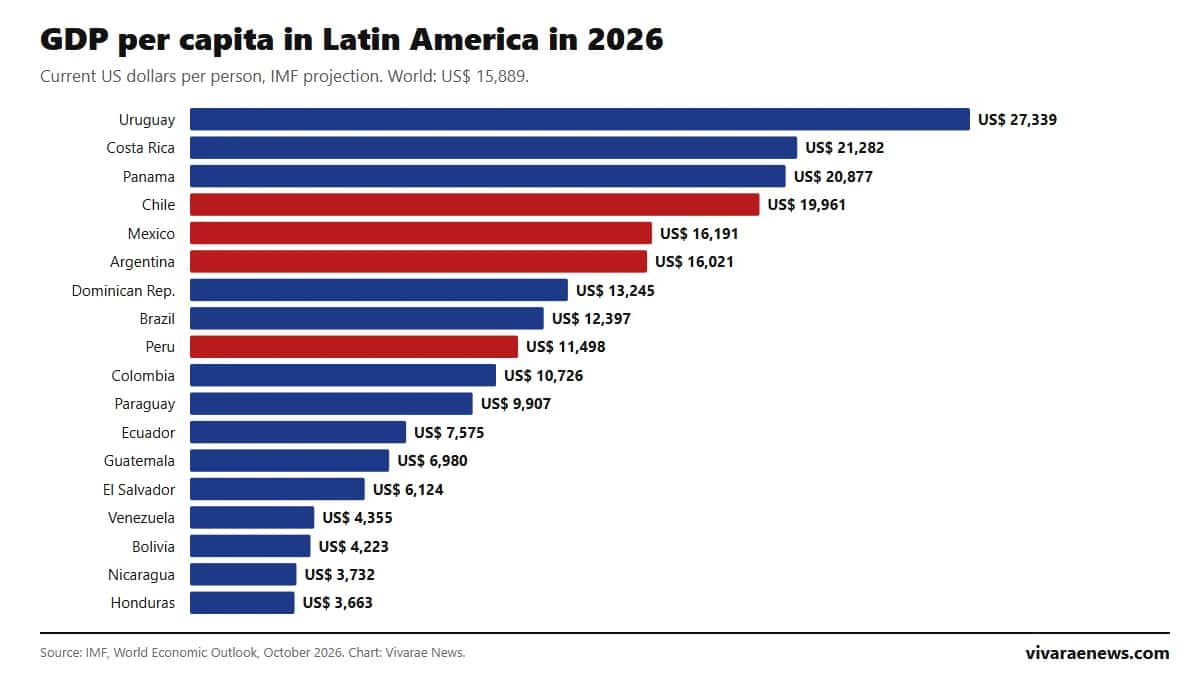
Uruguay will have Latin America's highest GDP per capita in 2026, US$ 27,339 per person, followed by Costa Rica (US$ 21,282), Panama (US$ 20,877) and Chile (US$ 19,961), according to the International Monetary Fund's October 2026 World Economic Outlook (WEO) database ([IMF](https://www.imf.org/external/datamapper/NGDPDPC@WEO/OEMDC/ADVEC/WEOWORLD)). Honduras closes the list at US$ 3,663: the gap between first and last is 7.5 times. The world average is US$ 15,889.
GDP per capita divides the value of what a country produces by its population. It does not measure household income or inequality, but it is the most widely used comparison of development levels. Here it is in current dollars and in purchasing power parity (PPP), which adjusts for what things cost in each country.
Latin America GDP per capita ranking for 2026
| Rank | Country | 2025 | 2026 (projection) | 2027 (projection) |
|---|---|---|---|---|
| 1 | Uruguay | US$ 24,549 | US$ 27,339 | US$ 28,923 |
| 2 | Costa Rica | US$ 19,162 | US$ 21,282 | US$ 22,779 |
| 3 | Panama | US$ 19,814 | US$ 20,877 | US$ 21,960 |
| 4 | Chile | US$ 17,837 | US$ 19,961 | US$ 20,415 |
| 5 | Mexico | US$ 13,759 | US$ 16,191 | US$ 17,095 |
| 6 | Argentina | US$ 14,399 | US$ 16,021 | US$ 15,741 |
| 7 | Dominican Republic | US$ 11,749 | US$ 13,245 | US$ 14,348 |
| 8 | Brazil | US$ 10,683 | US$ 12,397 | US$ 13,016 |
| 9 | Peru | US$ 9,938 | US$ 11,498 | US$ 11,783 |
| 10 | Colombia | US$ 8,617 | US$ 10,726 | US$ 11,817 |
| 11 | Paraguay | US$ 7,679 | US$ 9,907 | US$ 10,721 |
| 12 | Ecuador | US$ 7,199 | US$ 7,575 | US$ 7,839 |
| 13 | Guatemala | US$ 6,599 | US$ 6,980 | US$ 7,444 |
| 14 | El Salvador | US$ 5,751 | US$ 6,124 | US$ 6,453 |
| 15 | Venezuela | US$ 3,559 | US$ 4,355 | US$ 4,581 |
| 16 | Bolivia | US$ 5,185 | US$ 4,223 | n/a |
| 17 | Nicaragua | US$ 3,337 | US$ 3,732 | US$ 4,197 |
| 18 | Honduras | US$ 3,598 | US$ 3,663 | US$ 3,830 |
Source: IMF, October 2026 WEO database, indicator "GDP per capita, current prices" (IMF DataMapper). Figures rounded to whole dollars. "n/a": the IMF does not publish a 2027 projection for Bolivia. Six Latin American countries exceed the world average: Uruguay, Costa Rica, Panama, Chile, Mexico and Argentina.
GDP per capita in purchasing power parity
In current dollars, countries with strong or expensive currencies come out ahead. Purchasing power parity (PPP) adjusts for that difference, and the order changes: Panama moves to first place and Chile rises to third.
| PPP rank | Country | GDP per capita PPP 2026 | PPP / current dollars |
|---|---|---|---|
| 1 | Panama | US$ 47,129 | 2.26 times |
| 2 | Uruguay | US$ 39,008 | 1.43 times |
| 3 | Chile | US$ 37,008 | 1.85 times |
| 4 | Costa Rica | US$ 34,214 | 1.61 times |
| 5 | Argentina | US$ 32,899 | 2.05 times |
| 6 | Dominican Republic | US$ 32,597 | 2.46 times |
| 7 | Mexico | US$ 26,743 | 1.65 times |
| 8 | Brazil | US$ 24,594 | 1.98 times |
| 9 | Paraguay | US$ 23,662 | 2.39 times |
| 10 | Colombia | US$ 23,634 | 2.20 times |
| 11 | Peru | US$ 20,238 | 1.76 times |
| 12 | Ecuador | US$ 17,831 | 2.35 times |
| 13 | Guatemala | US$ 16,102 | 2.31 times |
| 14 | El Salvador | US$ 15,077 | 2.46 times |
| 15 | Bolivia | US$ 12,736 | 3.02 times |
| 16 | Nicaragua | US$ 10,256 | 2.75 times |
| 17 | Venezuela | US$ 9,902 | 2.27 times |
| 18 | Honduras | US$ 8,269 | 2.26 times |
Source: IMF DataMapper, indicator "GDP per capita, current international dollars (PPP)". The last column is our calculation: the higher it is, the further a dollar goes in that country. In Bolivia, PPP GDP is three times the current-dollar figure and in Nicaragua almost three; in Uruguay and Mexico the gap is smaller.
Who grew most since 2015
| Country | GDP per capita 2015 | GDP per capita 2026 | Change |
|---|---|---|---|
| Dominican Republic | US$ 7,120 | US$ 13,245 | +86% |
| Nicaragua | US$ 2,037 | US$ 3,732 | +83% |
| Costa Rica | US$ 11,635 | US$ 21,282 | +83% |
| Guatemala | US$ 3,893 | US$ 6,980 | +79% |
| Peru | US$ 6,453 | US$ 11,498 | +78% |
| Brazil | US$ 8,893 | US$ 12,397 | +39% |
| Ecuador | US$ 5,975 | US$ 7,575 | +27% |
| Bolivia | US$ 3,635 | US$ 4,223 | +16% |
| Argentina | US$ 14,895 | US$ 16,021 | +8% |
Our calculation using IMF data, in current dollars; it shows the five countries that rose most and the four that rose least. The Dominican Republic, Costa Rica, Nicaragua and Guatemala nearly doubled their dollar GDP per person in eleven years. Argentina is the opposite case: its 2026 GDP per capita is only 8% higher than in 2015, after repeated crises and devaluations. Bolivia falls from US$ 5,185 in 2025 to US$ 4,223 in 2026, a decline that coincides with the contraction the IMF projects for its economy (see the growth ranking).
How to read Latin America's GDP per capita
Three caveats. First, the 2026 figures are IMF projections, revised every April and October. Second, in current dollars the ranking moves with exchange rates: a devaluation lowers GDP per capita even if the economy has not shrunk, and a strong currency inflates it. Third, an average says nothing about how income is distributed: countries with similar GDP per capita can have very different poverty levels. To complete the picture, see the minimum wage in Latin America, unemployment and public debt by country. For Chile over the long term, see Chile's GDP growth over 50 years.
How to cite this data
You may use the figures and chart on this page by citing the original source (IMF, World Economic Outlook, October 2026) and Vivarae News. Suggested citation: "GDP per capita in Latin America: 2026 ranking by country according to the IMF", Vivarae News, updated October 23, 2026, https://vivaraenews.com/en/gdp-per-capita-in-latin-america-ranking-by-country-2026/. We update this page at the same address when the IMF releases new figures (April and October).
Frequently asked questions
Which Latin American country has the highest GDP per capita?
Uruguay, with US$ 27,339 in 2026 according to the IMF. In purchasing power parity, Panama, with US$ 47,129.
Which country has the lowest GDP per capita?
Honduras, with US$ 3,663 in 2026, followed by Nicaragua (US$ 3,732).
What is Chile's GDP per capita?
US$ 19,961 in 2026 according to the IMF, fourth in the region. In PPP, US$ 37,008, third.
What is Mexico's GDP per capita?
US$ 16,191 in 2026, above the world average of US$ 15,889.
How often is this ranking updated?
With each edition of the IMF's World Economic Outlook, in April and October.