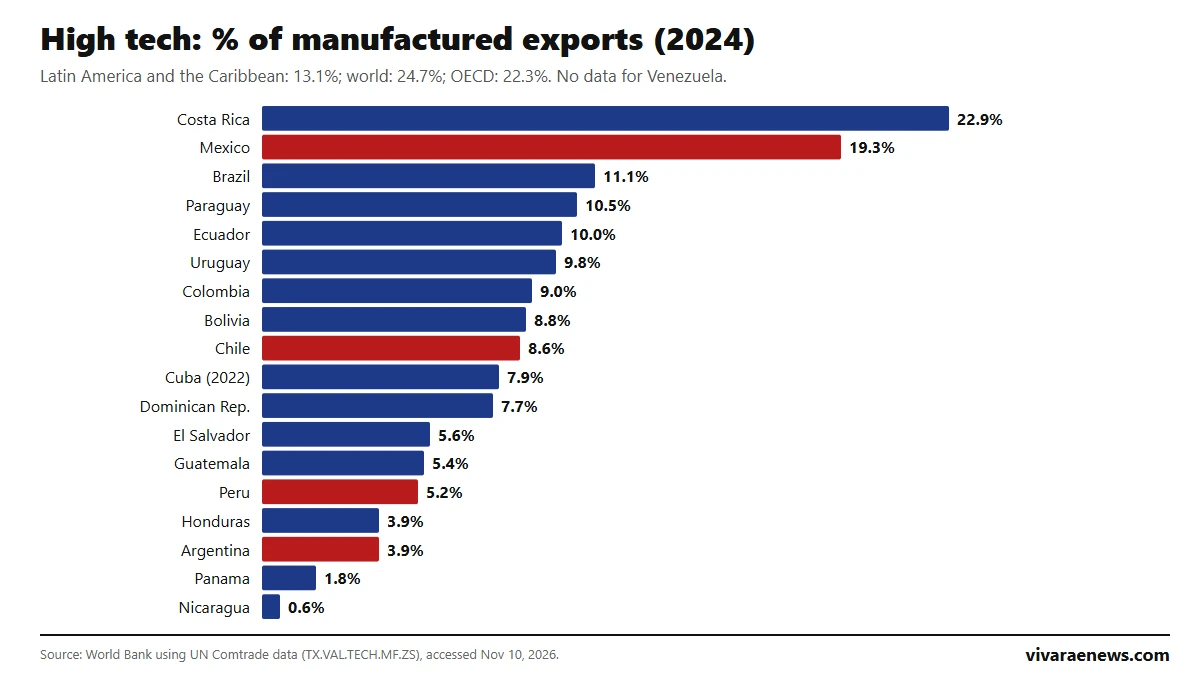
Costa Rica is the Latin American country where high-tech products weigh most in manufactured exports, 22.9% in 2024, followed by Mexico (19.3%) and Brazil (11.1%), according to the World Bank, using UN Comtrade data. Chile ranks 9 of 18, with 8.6%; Peru ranks 14 (5.2%) and Argentina 16 (3.9%). The Latin America and Caribbean average is 13.1%, versus 24.7% worldwide and 22.3% in the OECD.
In dollars, Mexico dominates by a wide margin: it exported US$94,524 million in high-tech products in 2024, 85% of the 18-country total. It is followed by Brazil (US$8,695 million) and Costa Rica (US$2,948 million). Chile exported US$1,077 million. This ranking of high-tech exports in Latin America is updated on this same page when the World Bank publishes new data.
View the data as a table
| Costa Rica | 22.9% |
| Mexico, in dollars | US$ 94.5 B |
| Chile | 8.6% |
| Latin America and the Caribbean | 13.1% |
Ranking of high-tech exports in Latin America
| Rank | Country | % of manufactured exports | High-tech exports (US$ million) | Year |
|---|---|---|---|---|
| 1 | Costa Rica | 22.9% | 2,948 | 2024 |
| 2 | Mexico | 19.3% | 94,524 | 2024 |
| 3 | Brazil | 11.1% | 8,695 | 2024 |
| 4 | Paraguay | 10.5% | 186 | 2024 |
| 5 | Ecuador | 10.0% | 154 | 2024 |
| 6 | Uruguay | 9.8% | 190 | 2024 |
| 7 | Colombia | 9.0% | 956 | 2024 |
| 8 | Bolivia | 8.8% | 51 | 2024 |
| 9 | Chile | 8.6% | 1,077 | 2024 |
| 10 | Cuba | 7.9% | 13 | 2022 |
| 11 | Dominican Rep. | 7.7% | 576 | 2024 |
| 12 | El Salvador | 5.6% | 247 | 2024 |
| 13 | Guatemala | 5.4% | 366 | 2024 |
| 14 | Peru | 5.2% | 286 | 2024 |
| 15 | Honduras | 3.9% | 105 | 2024 |
| 16 | Argentina | 3.9% | 409 | 2024 |
| 17 | Panama | 1.8% | 2 | 2024 |
| 18 | Nicaragua | 0.6% | 17 | 2024 |
Source: World Bank, using UN Comtrade data (TX.VAL.TECH.MF.ZS and TX.VAL.TECH.CD), accessed November 10, 2026. 2024 data; Cuba, 2022. No data for Venezuela. High tech covers products with high research and development intensity, such as aerospace, computers, pharmaceuticals, scientific instruments and electrical machinery. The indicator measures their weight in manufactured exports, not total exports: that is why countries that mainly export raw materials, such as Chile or Peru, can show a moderate share even though their manufacturing exports are small.
View the data as a table
| Costa Rica | 22.9% · 2024 |
| Mexico | 19.3% · 2024 |
| Brazil | 11.1% · 2024 |
| Paraguay | 10.5% · 2024 |
| Ecuador | 10.0% · 2024 |
| Uruguay | 9.8% · 2024 |
| Colombia | 9.0% · 2024 |
| Bolivia | 8.8% · 2024 |
| Chile | 8.6% · 2024 |
| Cuba | 7.9% · 2022 |
| Dominican Republic | 7.7% · 2024 |
| El Salvador | 5.6% · 2024 |
| Guatemala | 5.4% · 2024 |
| Peru | 5.2% · 2024 |
| Honduras | 3.9% · 2024 |
| Argentina | 3.9% · 2024 |
| Panama | 1.8% · 2024 |
| Nicaragua | 0.6% · 2024 |
Who sells the most high tech in dollars
Share and value tell different stories. Panama and Nicaragua sit at the bottom of the percentage ranking with less than 2%, but in dollars five countries account for almost everything: Mexico, Brazil, Costa Rica, Chile and Colombia make up more than 97% of the value exported by the 18 countries. Argentina, which exported US$1,686 million in high tech in 2010, fell to US$409 million in 2024.
High-tech exports in Chile, Mexico, Argentina and Peru since 2010
Chile went from 6.2% in 2010 to 8.6% in 2024, with a jump to 16.0% in 2020. Mexico fell from 22.1% to 19.3%, although its dollar sales grew from US$49,222 million to US$94,524 million. Argentina fell from 7.7% to 3.9% and Peru from 8.6% to 5.2%.
View the data as a table
| Costa Rica | Mexico | Brazil | Chile | Peru | Argentina | |
|---|---|---|---|---|---|---|
| 2010 | 40.1% | 22.1% | 12.6% | 6.2% | 8.6% | 7.7% |
| 2012 | 39.8% | 21.4% | 11.9% | 5.4% | 4.7% | 6.6% |
| 2014 | 36.5% | 20.2% | 12.4% | 7.1% | 4.3% | 7.1% |
| 2016 | 18.4% | 20.6% | 16.0% | 8.4% | 4.8% | 9.0% |
| 2018 | 18.5% | 20.9% | 14.7% | 6.9% | 4.7% | 5.4% |
| 2020 | 15.7% | 21.5% | 11.3% | 16.0% | 4.8% | 6.9% |
| 2022 | 22.0% | 20.4% | 9.1% | 6.9% | 4.6% | 4.8% |
| 2024 | 22.9% | 19.3% | 11.1% | 8.6% | 5.2% | 3.9% |
| Country | 2010 | 2012 | 2014 | 2016 | 2018 | 2020 | 2022 | 2024 |
|---|---|---|---|---|---|---|---|---|
| Costa Rica | 40.1% | 39.8% | 36.5% | 18.4% | 18.5% | 15.7% | 22.0% | 22.9% |
| Mexico | 22.1% | 21.4% | 20.2% | 20.6% | 20.9% | 21.5% | 20.4% | 19.3% |
| Brazil | 12.6% | 11.9% | 12.4% | 16.0% | 14.7% | 11.3% | 9.1% | 11.1% |
| Chile | 6.2% | 5.4% | 7.1% | 8.4% | 6.9% | 16.0% | 6.9% | 8.6% |
| Peru | 8.6% | 4.7% | 4.3% | 4.8% | 4.7% | 4.8% | 4.6% | 5.2% |
| Argentina | 7.7% | 6.6% | 7.1% | 9.0% | 5.4% | 6.9% | 4.8% | 3.9% |
Source: World Bank, using UN Comtrade data (TX.VAL.TECH.MF.ZS and TX.VAL.TECH.CD), accessed November 10, 2026. For other regional trade and economic indicators with the same method, see the ranking of exports to the United States and the one for research and development spending.
Frequently asked questions
Which Latin American country exports the most high tech?
In dollars, Mexico: US$94,524 million in 2024. As a share of manufactures, Costa Rica: 22.9%.
How much high tech does Chile export?
US$1,077 million in 2024, 8.6% of its manufactured exports, according to the World Bank.
What counts as high tech?
Products with high research and development intensity: aerospace, computers, pharmaceuticals, scientific instruments and electrical machinery, among others.
How often is this ranking updated?
When the World Bank publishes new data, usually once a year. It is updated at this same URL.
How to cite this data
Vivarae News (2026). "High-tech exports in Latin America: ranking by country 2026". Updated November 10, 2026. Available at https://vivaraenews.com/en/high-tech-exports-in-latin-america-ranking-by-country-2026/. The data may be reproduced by citing Vivarae News and linking to this page; each country's figures come from the World Bank, using UN Comtrade data.