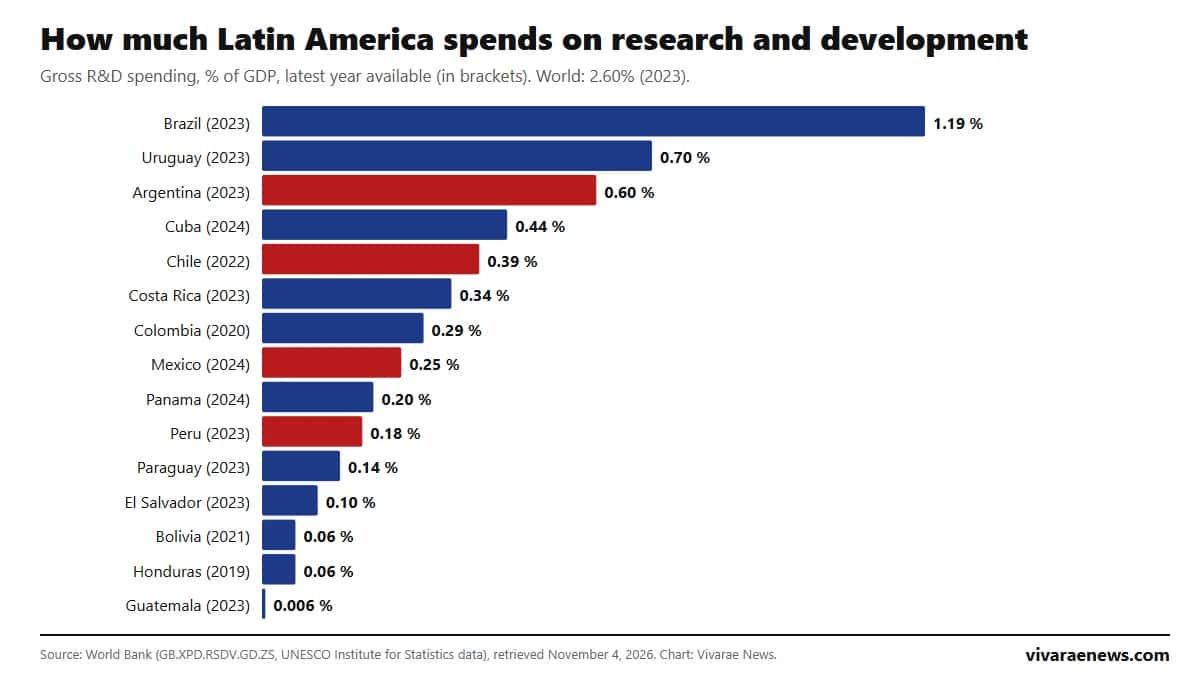
Brazil is the Latin American country that invests the most in research and development (R&D): 1.19% of its GDP in 2023, according to the World Bank. It is followed by Uruguay (0.70%) and Argentina (0.60%). Chile spends 0.39% (2022), Mexico 0.25% (2024) and Peru 0.18% (2023). The Latin America and Caribbean average is 0.68% and the world average 2.60%: relative to the size of its economy, the region invests about a quarter of the global average in science.
The ranking uses the World Bank indicator GB.XPD.RSDV.GD.ZS, which compiles UNESCO Institute for Statistics data and measures gross R&D spending by businesses, government, universities and nonprofits. For each country we take the latest year available, retrieved on November 4, 2026. Countries with data older than 2019 are shown separately.
Ranking of research and development spending in Latin America
| Rank | Country | R&D spending (% of GDP) | Year |
|---|---|---|---|
| 1 | Brazil | 1.19% | 2023 |
| 2 | Uruguay | 0.70% | 2023 |
| 3 | Argentina | 0.60% | 2023 |
| 4 | Cuba | 0.44% | 2024 |
| 5 | Chile | 0.39% | 2022 |
| 6 | Costa Rica | 0.34% | 2023 |
| 7 | Colombia | 0.29% | 2020 |
| 8 | Mexico | 0.25% | 2024 |
| 9 | Panama | 0.20% | 2024 |
| 10 | Peru | 0.18% | 2023 |
| 11 | Paraguay | 0.14% | 2023 |
| 12 | El Salvador | 0.10% | 2023 |
| 13 | Bolivia | 0.06% | 2021 |
| 14 | Honduras | 0.06% | 2019 |
| 15 | Guatemala | 0.006% | 2023 |
| — | Latin America and the Caribbean | 0.68% | 2023 |
| — | World | 2.60% | 2023 |
| — | OECD members | 2.93% | 2023 |
Three countries have data too old to compare with the rest: Ecuador (0.44% in 2014), Venezuela (0.34% in 2014) and Nicaragua (0.11% in 2015). The Dominican Republic has no data for this indicator at the World Bank. Source for the whole table: World Bank.
Latin America versus the world in research and development
The gap with innovation leaders is wide. Israel invests 6.35% of its GDP in R&D, South Korea 4.94% and the United States 3.45%, according to 2023 data for the same World Bank indicator. Even Brazil, the regional leader, trails Spain and Portugal.
| Country or group | R&D spending (% of GDP, 2023) |
|---|---|
| Israel | 6.35% |
| South Korea | 4.94% |
| United States | 3.45% |
| OECD members | 2.93% |
| World | 2.60% |
| China | 2.58% |
| Portugal | 1.69% |
| Spain | 1.49% |
| Brazil (Latin America's top spender) | 1.19% |
| Latin America and the Caribbean | 0.68% |

How R&D spending in Latin America has changed since 2014
The regional average fell from 0.75% of GDP in 2014 to 0.68% in 2023. Uruguay rose the most over the decade (from 0.32% to 0.70%), while Mexico dropped from 0.42% to 0.25%. Chile has stalled between 0.34% and 0.39%. The issue is live in Chile: the 2027 budget cuts funding for the Science Ministry.
| Country | 2014 | 2016 | 2018 | 2020 | 2022 | 2023 |
|---|---|---|---|---|---|---|
| Brazil | 1.27% | 1.20% | 1.15% | 1.22% | 1.19% | 1.19% |
| Argentina | 0.59% | 0.56% | 0.49% | 0.54% | 0.55% | 0.60% |
| Uruguay | 0.32% | 0.37% | 0.50% | 0.68% | 0.62% | 0.70% |
| Chile | 0.38% | 0.37% | 0.37% | 0.34% | 0.39% | n/a |
| Mexico | 0.42% | 0.38% | 0.30% | 0.29% | 0.26% | 0.27% |
| Latin America and the Caribbean | 0.75% | 0.69% | 0.64% | 0.64% | 0.66% | 0.68% |
"n/a": no data published for that year. Mexico also has a 2024 figure (0.25%). Source: World Bank.
Researchers and patents: the other science indicators in Latin America
Spending is not the only yardstick. Cuba has the most researchers per million people in the region (2,171 in 2024), followed by Argentina (1,313) and Uruguay (938), according to the World Bank. Chile has 707 (2022) and Mexico 438 (2024). The OECD average is 4,464.
| Country | Researchers per million people | Resident patent applications (2024) |
|---|---|---|
| Brazil | 903 (2014) | 5,752 |
| Mexico | 438 (2024) | 1,172 |
| Argentina | 1,313 (2023) | 445 |
| Chile | 707 (2022) | 390 |
| Colombia | 90 (2017) | 270 |
| Peru | n/a | 214 |
| Uruguay | 938 (2024) | 13 |
| Cuba | 2,171 (2024) | 12 |
| Costa Rica | 508 (2023) | 15 |
Resident patents count applications filed by people or companies from the country itself (World Bank, with WIPO data). In 2024, Latin America and the Caribbean filed 8,458 applications, against 2.7 million worldwide. Brazil accounts for two thirds of the regional total.

Why the region invests little in research and development
In the countries that invest the most, businesses carry out most R&D. In Latin America the burden falls on the state and universities, so the indicator depends heavily on public budgets. That is why it barely moves from year to year and falls during fiscal adjustments. Other regional indicators are in our rankings of education spending and GDP per capita.
World Bank figures may differ from those published by each country or by the Network on Science and Technology Indicators (RICYT), because of differences in method and update dates. This ranking is updated at the same address when new data come out.
How to cite this data
Vivarae News (2026). "Research and development spending in Latin America: ranking by country 2026". Updated November 4, 2026. Available at https://vivaraenews.com/en/research-and-development-spending-in-latin-america-ranking-by-country-2026/. The data may be reproduced by citing Vivarae News and linking to this page; each country's figures come from the World Bank and the UNESCO Institute for Statistics.
Frequently asked questions
Which Latin American country invests the most in research and development?
Brazil, with 1.19% of GDP in 2023, according to the World Bank. It is followed by Uruguay (0.70%) and Argentina (0.60%).
How much does Chile invest in R&D?
0.39% of GDP in 2022, the latest year available at the World Bank. It ranks fifth in the region and below the Latin American average (0.68%).
How much does Mexico invest in science?
0.25% of GDP in 2024, less than in 2014 (0.42%), according to the World Bank.
What is the world average for R&D spending?
2.60% of GDP in 2023. In OECD countries it is 2.93%, and in Latin America and the Caribbean, 0.68%.