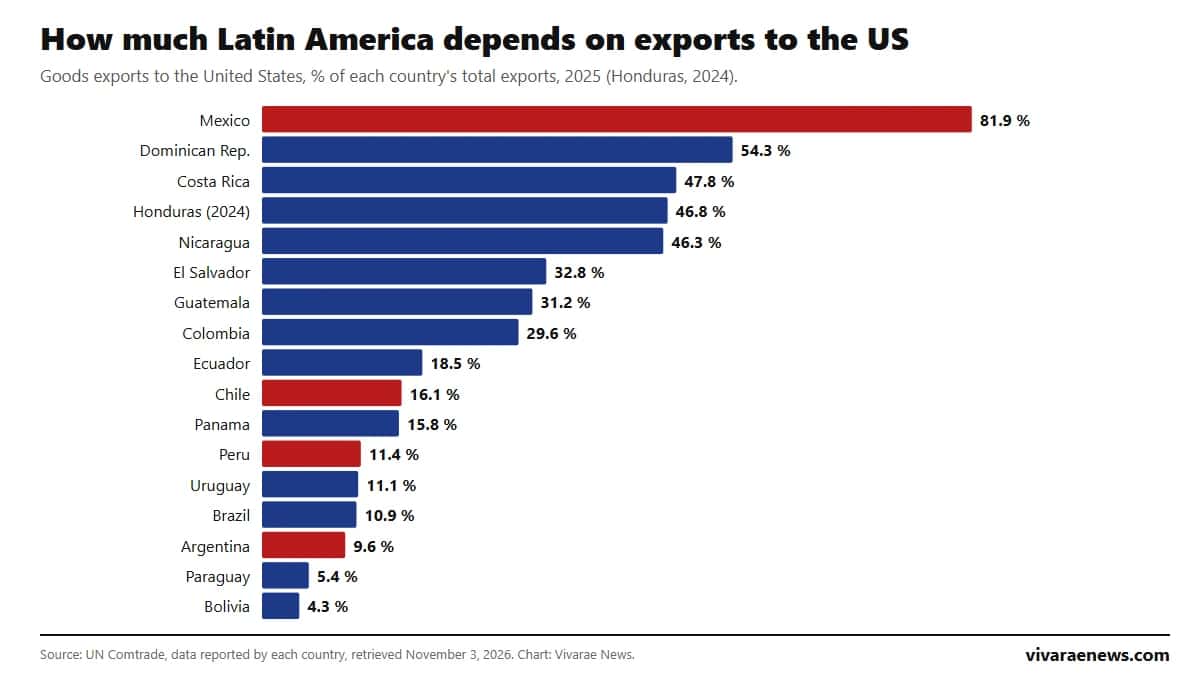
Mexico is by far the Latin American country most dependent on the United States: in 2025 it sold US$545.388 billion in goods there, 81.9% of everything it exported, according to the figures Mexico itself reports to UN Comtrade, the United Nations trade database. It is followed by the Dominican Republic (54.3%), Costa Rica (47.8%), Honduras (46.8%, 2024 data) and Nicaragua (46.3%). At the other end, Bolivia (4.3%), Paraguay (5.4%) and Argentina (9.6%) depend least on the US market.
*Updated on November 3, 2026*, the day of the US midterm elections. This ranking will be updated on this same page when countries report their 2026 figures.
Ranking of exports to the United States in Latin America, 2025
The chart ranks 17 countries by the weight of the United States in their goods exports. Venezuela and Cuba are not included because they do not report recent data to UN Comtrade.
| # | Country | Exports to the US, 2025 | Total exports, 2025 | % to the US | Change in sales to the US vs. 2024 |
|---|---|---|---|---|---|
| 1 | Mexico | US$545,388 M | US$665,934 M | 81.9% | +8.3% |
| 2 | Dominican Republic | US$7,810 M | US$14,373 M | 54.3% | +2.4% |
| 3 | Costa Rica | US$10,829 M | US$22,638 M | 47.8% | +13.7% |
| 4 | Honduras (2024) | US$3,261 M | US$6,971 M | 46.8% | — |
| 5 | Nicaragua | US$4,037 M | US$8,722 M | 46.3% | +10.9% |
| 6 | El Salvador | US$2,111 M | US$6,429 M | 32.8% | −2.5% |
| 7 | Guatemala | US$4,870 M | US$15,611 M | 31.2% | −0.2% |
| 8 | Colombia | US$14,872 M | US$50,201 M | 29.6% | −0.7% |
| 9 | Ecuador | US$6,888 M | US$37,152 M | 18.5% | +8.3% |
| 10 | Chile | US$17,740 M | US$110,355 M | 16.1% | +13.2% |
| 11 | Panama | US$264 M | US$1,668 M | 15.8% | +12.9% |
| 12 | Peru | US$10,231 M | US$90,081 M | 11.4% | +6.8% |
| 13 | Uruguay | US$1,255 M | US$11,291 M | 11.1% | +31.4% |
| 14 | Brazil | US$38,104 M | US$348,676 M | 10.9% | −6.9% |
| 15 | Argentina | US$8,327 M | US$87,111 M | 9.6% | +28.6% |
| 16 | Paraguay | US$593 M | US$11,082 M | 5.4% | +43.5% |
| 17 | Bolivia | US$420 M | US$9,702 M | 4.3% | +37.4% |
Source: UN Comtrade, query to the public API on November 3, 2026, with the values reported by each exporting country. M = millions of dollars. Shares and changes: VIVARAE NEWS calculation. Honduras has not yet reported 2025. Panama shows a low total because its national statistics exclude re-exports from the Colón Free Zone.
Mexico, the country most dependent on the US market
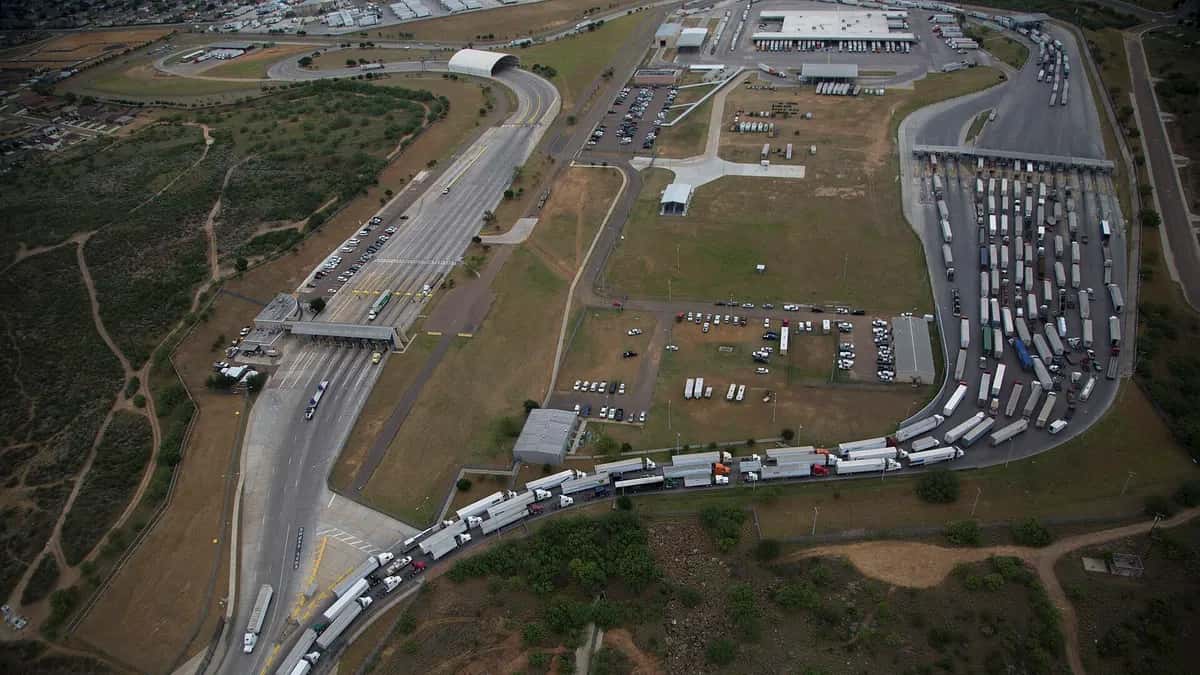
Mexico alone accounts for 80% of what Latin America sells to the United States: of the US$677.001 billion that the 17 countries in the ranking exported to that market, US$545.388 billion came from Mexico. Without Mexico, the US share of the rest of the region's exports drops to 15.8%. Mexican sales kept growing in 2025 (+8.3%), and in September 2026 Mexican exports grew 37.9% year on year.
The Mexican government is negotiating the USMCA review and aims to sign it before the end of 2026, said Economy Secretary Marcelo Ebrard, who stated that Mexico faces effective tariffs of 3% to 3.2%, compared with 22% for China, according to Reporte Índigo. See what is at stake for Mexico in the US midterm elections.
Central America and the Caribbean: the second region most exposed to the United States
The five countries that follow Mexico in the ranking are in Central America and the Caribbean: the Dominican Republic, Costa Rica, Honduras, Nicaragua and El Salvador sell between a third and more than half of their exports to the United States. Costa Rica increased its sales to that market by 13.7% in 2025. In these countries, remittances from the United States also weigh heavily on the economy.
Exports to the United States versus China in South America
In South America the US share is smaller. Colombia is the exception, at 29.6%. For Chile, Peru, Brazil and Bolivia, China is a more important destination than the United States, according to the same UN Comtrade figures:
| Country | % of exports to the US (2025) | % of exports to China (2025) | Exports to China, 2025 |
|---|---|---|---|
| Chile | 16.1% | 36.8% | US$40,647 M |
| Peru | 11.4% | 36.2% | US$32,628 M |
| Brazil | 10.9% | 28.7% | US$100,021 M |
| Bolivia | 4.3% | 19.1% | US$1,854 M |
| Ecuador | 18.5% | 16.1% | US$5,988 M |
| Uruguay | 11.1% | 16.0% | US$1,801 M |
| Argentina | 9.6% | 11.2% | US$9,717 M |
| Colombia | 29.6% | 3.3% | US$1,645 M |
| Paraguay | 5.4% | 0.5% | US$53 M |
| Mexico (reference) | 81.9% | 1.5% | US$9,916 M |
Source: UN Comtrade, partner China (code 156), data reported by each country. VIVARAE NEWS calculation. Chile and Peru sell proportionally more than twice as much to China as to the United States; Colombia and Mexico, the opposite.
Brazil had the largest drop in the ranking in its sales to the United States in 2025 (−6.9%): that year Washington applied an additional 40% tariff that, added to the 10% base rate, took the total to 50% on many products, and in July 2026 it added new measures, according to Infobae. The two countries set up a working group in September to negotiate.
| Subregion | Countries in the ranking | Exports to the US, 2025 | % of total |
|---|---|---|---|
| Mexico | 1 | US$545,388 M | 81.9% |
| Central America, Panama and the Dominican Republic | 7 | US$33,182 M | 43.4% |
| South America | 9 | US$98,431 M | 13.0% |
| Total for the 17 countries | 17 | US$677,001 M | 45.2% |
VIVARAE NEWS calculation with UN Comtrade data. Central America includes Honduras with 2024 data. Among the large South American exporters, Argentina (+28.6%) and Chile (+13.2%) posted the biggest increases in sales to the United States in 2025.
How the ranking of exports to the United States was calculated
- Source: UN Comtrade, TOTAL code (all goods), export flow, partner United States (code 842) versus world total (code 0).
- Year: 2025, the latest full year. Honduras, 2024. Venezuela and Cuba are excluded for lack of data.
- Goods only: services such as tourism or software, and remittances, are not included.
- Figures may differ from US data: what a country reports as exports does not always match what the US records as imports, because of differences in valuation (FOB and CIF), timing and re-exports.
How to cite this data
Vivarae News (2026). "Exports to the United States in Latin America: ranking by country 2026". Updated November 3, 2026. Available at https://vivaraenews.com/en/exports-to-the-united-states-in-latin-america-ranking-by-country-2026/. The data may be reproduced by citing Vivarae News and linking to this page; each country's figures come from UN Comtrade.
Frequently asked questions
Which Latin American country exports the most to the United States?
Mexico, with US$545.388 billion in 2025, 81.9% of its exports, according to UN Comtrade. Brazil follows with US$38.104 billion (10.9% of its total).
How much does Chile export to the United States?
US$17.740 billion in 2025, 16.1% of its total exports and 13.2% more than in 2024.
Which country depends least on the United States?
Bolivia, which sends 4.3% of its exports there, followed by Paraguay (5.4%) and Argentina (9.6%).
How much does Latin America export to the United States?
The 17 countries in the ranking totaled US$677.001 billion in 2025, 45.2% of their exports. Without Mexico, the figure falls to US$131.613 billion (15.8%).