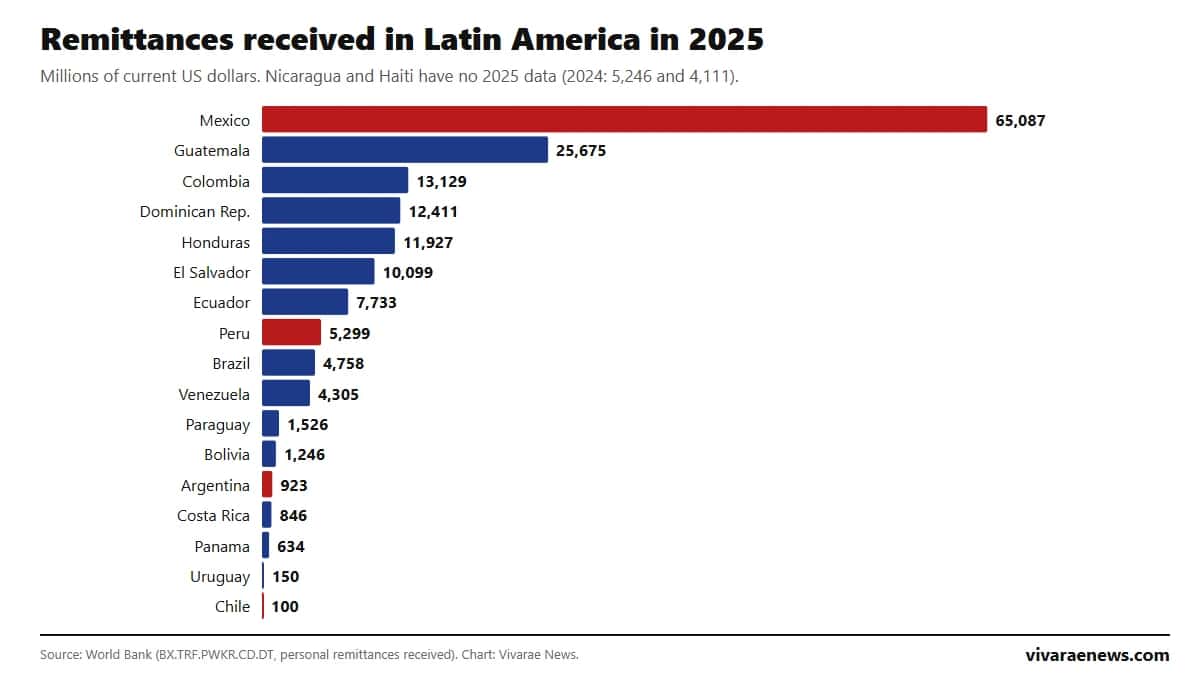
Seventeen Latin American countries received US$165.85 billion in remittances in 2025, 6.4% more than in 2024, according to [World Bank](https://data.worldbank.org/indicator/BX.TRF.PWKR.CD.DT) data updated in 2026. Mexico remains first with US$65.09 billion, 39% of the total, but it was one of the few countries where they fell: −4.2%. Relative to the economy, Honduras ranks first, with remittances equal to 30.1% of GDP.
Remittances are the money people working abroad send home. In Central America they sustain consumption for millions of households. This ranking uses the World Bank's personal remittances received indicator, comparable across countries, and will be updated on this same page when 2026 data come out.
Ranking of remittances in Latin America in 2025
| Rank | Country | Remittances 2025 (US$ million) | Change vs. 2024 | Share of regional total |
|---|---|---|---|---|
| 1 | Mexico | 65,087 | −4.2% | 39.2% |
| 2 | Guatemala | 25,675 | +18.6% | 15.5% |
| 3 | Colombia | 13,129 | +10.6% | 7.9% |
| 4 | Dominican Republic | 12,411 | +9.4% | 7.5% |
| 5 | Honduras | 11,927 | +25.3% | 7.2% |
| 6 | El Salvador | 10,099 | +19.0% | 6.1% |
| 7 | Ecuador | 7,733 | +18.2% | 4.7% |
| 8 | Peru | 5,299 | +7.4% | 3.2% |
| 9 | Brazil | 4,758 | −2.9% | 2.9% |
| 10 | Venezuela | 4,305 | +13.1% | 2.6% |
| 11 | Paraguay | 1,526 | +34.3% | 0.9% |
| 12 | Bolivia | 1,246 | −1.8% | 0.8% |
| 13 | Argentina | 923 | −12.5% | 0.6% |
| 14 | Costa Rica | 846 | +16.7% | 0.5% |
| 15 | Panama | 634 | +19.4% | 0.4% |
| 16 | Uruguay | 150 | +10.2% | 0.1% |
| 17 | Chile | 100 | 0.0% | 0.1% |
Source: World Bank, indicator BX.TRF.PWKR.CD.DT, current US dollars; changes and shares are our own calculation. Nicaragua (US$5.25 billion in 2024) and Haiti (US$4.11 billion in 2024) have no 2025 data and are excluded; Cuba has no data in the series. The US$165.85 billion total adds up the 17 countries with 2025 data.
How much they weigh in each economy
| Country | Remittances / GDP 2025 | Remittances / GDP 2024 |
|---|---|---|
| Honduras | 30.1% | 25.7% |
| El Salvador | 27.5% | 24.3% |
| Guatemala | 20.8% | 19.1% |
| Dominican Republic | 9.7% | 9.1% |
| Ecuador | 5.9% | 5.3% |
| Venezuela | 4.3% | 3.2% |
| Mexico | 3.6% | 3.7% |
| Paraguay | 3.1% | 2.5% |
| Colombia | 2.9% | 2.8% |
| Peru | 1.6% | 1.7% |
| Chile | 0.03% | 0.03% |
Source: World Bank, BX.TRF.PWKR.DT.GD.ZS. Nicaragua (26.6% of GDP) and Haiti (16.9%) had some of the region's highest shares in 2024. In the three northern Central American countries, remittances weigh more than any export.

In 2025 remittances grew strongly across most of the region: Paraguay (+34.3%), Honduras (+25.3%), Panama (+19.4%), El Salvador (+19.0%), Guatemala (+18.6%) and Ecuador (+18.2%) posted double-digit gains. They fell in only five countries: Mexico (−4.2%), Brazil (−2.9%), Bolivia (−1.8%), Argentina (−12.5%) and Chile, which was flat. Excluding Mexico, the rest of the region grew 14.5%, by our calculation with World Bank data.
How remittances in Latin America have grown since 2015
| Country | 2015 | 2020 | 2025 | Times multiplied |
|---|---|---|---|---|
| Mexico | 26,825 | 43,978 | 65,087 | 2.4 |
| Guatemala | 6,482 | 11,405 | 25,675 | 4.0 |
| Honduras | 3,666 | 5,589 | 11,927 | 3.3 |
| Colombia | 5,002 | 6,925 | 13,129 | 2.6 |
| Ecuador | 2,388 | 3,344 | 7,733 | 3.2 |
| Venezuela | 234 | 2,626 | 4,305 | 18.4 |
| Peru | 2,765 | 2,907 | 5,299 | 1.9 |
| Total of the 17 countries | 63,223 | 165,850 | 2.6 |
Source: World Bank, US$ million at current prices; our own calculation. Venezuela's jump reflects the emigration of more than seven million people since 2015. Figures are not adjusted for dollar inflation.
Remittances to Mexico and Vivarae's four countries
Mexico accounts for nearly four of every ten dollars reaching the region, owing to emigration to the United States. Its 2025 decline coincides with tighter US immigration policy; the World Bank does not attribute causes. Note: the Bank of Mexico publishes somewhat lower "remittance income" figures, because the World Bank also adds compensation of temporary workers. Peru received US$5.30 billion (+7.4%); Argentina US$923 million (−12.5%); and Chile, mainly a sender of remittances, barely US$100 million. The effect on the region's currencies is in our currency ranking.
How to read this ranking
- These are personal remittances received: household transfers and pay of workers living abroad, following the IMF methodology applied by the World Bank.
- Figures are in current dollars and may be revised when central banks correct their balance of payments.
- Informal transfers do not appear, so the real amount may be higher, especially in Venezuela and Cuba.
Other regional rankings with official data: GDP per capita, unemployment and population.
How to cite this data
Vivarae News (2026). "Remittances in Latin America 2025: ranking by country, in dollars and as a share of GDP". Updated October 27, 2026. Available at https://vivaraenews.com/en/remittances-in-latin-america-ranking-by-country-2025/. The data may be reproduced citing Vivarae News and linking to this page; each country's figures belong to the World Bank.
Frequently asked questions
Which Latin American country receives the most remittances?
Mexico, with US$65.09 billion in 2025, according to the World Bank, followed by Guatemala (US$25.68 billion) and Colombia (US$13.13 billion).
Where do remittances weigh the most?
In Honduras, where they equal 30.1% of GDP in 2025, followed by El Salvador (27.5%) and Guatemala (20.8%).
How much did Latin America receive in remittances in 2025?
US$165.85 billion across the 17 countries with data, 6.4% more than in 2024.
Did remittances to Mexico fall in 2025?
Yes, 4.2%, from US$67.91 billion to US$65.09 billion according to the World Bank.
How much does Chile receive in remittances?
About US$100 million a year, 0.03% of GDP: Chile sends far more remittances than it receives.