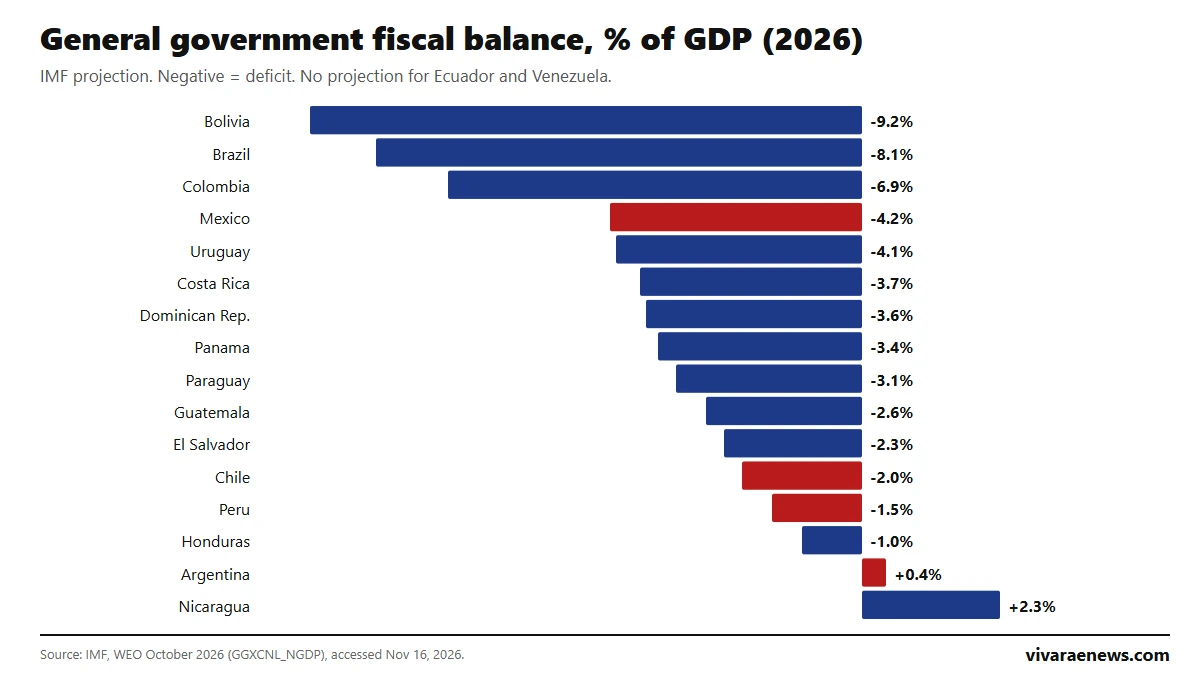
Bolivia will have the largest fiscal deficit in Latin America in 2026: its government will spend 9.2% of GDP more than it collects, according to the October projections of the International Monetary Fund. It is followed by Brazil (8.1%), Colombia (6.9%) and Mexico (4.2%). Only two countries will end the year with a surplus: Nicaragua (2.3%) and Argentina (0.4%). Chile will have a deficit of 2.0% and Peru 1.5%. The simple average of the 16 countries with a projection is a deficit of 3.3% of GDP.
The fiscal deficit is the gap between what the general government (central government, regions or provinces, municipalities and social security) collects and what it spends, including interest on debt. The IMF measures it as "net lending or borrowing" as a percentage of GDP so countries can be compared. This ranking of the fiscal deficit in Latin America is updated on this same page with each edition of the World Economic Outlook, in April and October.
View the data as a table
| Bolivia | -9.2% |
| Brazil | -8.1% |
| Chile | -2.0% |
| Argentina | 0.4% |
Ranking of the fiscal deficit in Latin America in 2026
| Rank | Country | Balance 2026 (% of GDP) | Balance 2025 | Balance 2027 | Gross debt 2026 (% of GDP) |
|---|---|---|---|---|---|
| 1 | Bolivia | -9.2 | -11.4 | -6.7 | 100.2 |
| 2 | Brazil | -8.1 | -7.4 | -7.7 | 97.0 |
| 3 | Colombia | -6.9 | -5.8 | -6.6 | 59.5 |
| 4 | Mexico | -4.2 | -4.9 | -3.9 | 62.1 |
| 5 | Uruguay | -4.1 | -3.4 | -3.4 | 67.7 |
| 6 | Costa Rica | -3.7 | -3.4 | -3.9 | 61.8 |
| 7 | Dominican Rep. | -3.6 | -3.6 | -3.4 | 57.2 |
| 8 | Panama | -3.4 | -3.7 | -3.0 | 56.4 |
| 9 | Paraguay | -3.1 | -1.7 | -3.1 | 36.6 |
| 10 | Guatemala | -2.6 | -1.9 | -3.0 | 27.5 |
| 11 | El Salvador | -2.3 | -2.9 | -7.7 | 85.0 |
| 12 | Chile | -2.0 | -2.8 | -1.6 | 42.8 |
| 13 | Peru | -1.5 | -2.4 | -1.6 | 28.6 |
| 14 | Honduras | -1.0 | -0.7 | -1.0 | 44.0 |
| 15 | Argentina | +0.4 | -0.2 | +0.7 | 69.3 |
| 16 | Nicaragua | +2.3 | +3.5 | +2.5 | 31.7 |
Source: International Monetary Fund (IMF), World Economic Outlook (WEO) October 2026, indicator "general government net lending/borrowing" (% of GDP), accessed November 16, 2026; general government gross debt, indicator GGXWDG_NGDP. Projection for 2026. Ecuador and Venezuela have no projection in the WEO. Negative values = deficit; positive = surplus. For 2025, the IMF estimates a deficit of 2.8% in Ecuador and 4.5% in Venezuela. The 2025 figures are estimates and those for 2026 and 2027 are projections; they may differ from each country's budget, which often covers only the central government.
View the data as a table
| Nicaragua | 2.3% |
| Argentina | 0.4% |
| Honduras | -1.0% |
| Peru | -1.5% |
| Chile | -2.0% |
| El Salvador | -2.3% |
| Guatemala | -2.6% |
| Paraguay | -3.1% |
| Panama | -3.4% |
| Dominican Republic | -3.6% |
| Costa Rica | -3.7% |
| Uruguay | -4.1% |
| Mexico | -4.2% |
| Colombia | -6.9% |
| Brazil | -8.1% |
| Bolivia | -9.2% |

Fiscal deficit and public debt: the most exposed countries
Each year's deficit adds to the debt. That is why the most delicate cases are those that combine a high deficit with high debt: Bolivia, with debt at 100.2% of GDP in 2026, and Brazil, at 97.0%, according to the IMF. Colombia (59.5%) and Mexico (62.1%) have lower debt, but deficits above 4% of GDP in 2026. At the other end, Argentina projects a small surplus and debt of 69.3% of GDP, down from 89.8% in 2019, and Chile, Peru and Guatemala combine moderate deficits with debt below 45%.
View the data as a table
| Fiscal balance 2026 (% of GDP) | Gross debt 2026 (% of GDP) | |
|---|---|---|
| Bolivia | -9.2% | 100.2% |
| Brazil | -8.1% | 97.0% |
| Colombia | -6.9% | 59.5% |
| Mexico | -4.2% | 62.1% |
| Uruguay | -4.1% | 67.7% |
| Costa Rica | -3.7% | 61.8% |
| Dominican Rep. | -3.6% | 57.2% |
| Panama | -3.4% | 56.4% |
| Paraguay | -3.1% | 36.6% |
| Guatemala | -2.6% | 27.5% |
| El Salvador | -2.3% | 85.0% |
| Chile | -2.0% | 42.8% |
| Peru | -1.5% | 28.6% |
| Honduras | -1.0% | 44.0% |
| Argentina | 0.4% | 69.3% |
| Nicaragua | 2.3% | 31.7% |
For a detailed look at the whole region's debt, see the ranking of public debt in Latin America; for borrowing costs, the ranking of interest rates, and for the growth projected in the same IMF report, the ranking of economic growth.
How Latin America's fiscal deficit has changed since the pandemic
In 2020, pandemic spending sent deficits soaring: Brazil reached 11.6% of GDP, Bolivia 11.0%, Peru 8.2% and Chile 7.1%. Since then, most have corrected, but at very different speeds. Argentina went from a 8.7% deficit in 2020 to a 0.5% surplus in 2024, a slight deficit in 2025 (0.2%) and a projected 0.4% surplus in 2026; Peru is back to 1.5% and Chile to 2.0%. Bolivia and Brazil, however, still run larger deficits than before the pandemic, and Mexico, at 4.3% in 2020, will have 4.2% in 2026, above its 2019 level (2.3%).
View the data as a table
| Brazil | Bolivia | Mexico | Peru | Argentina | Chile | |
|---|---|---|---|---|---|---|
| 2015 | -9.3% | -5.8% | -3.9% | -2.0% | -6.0% | -2.1% |
| 2017 | -8.0% | -6.4% | -1.0% | -2.8% | -6.7% | -2.6% |
| 2019 | -4.9% | -6.0% | -2.3% | -1.4% | -4.4% | -2.7% |
| 2020 | -11.6% | -11.0% | -4.3% | -8.2% | -8.7% | -7.1% |
| 2021 | -2.6% | -7.9% | -3.7% | -2.5% | -4.3% | -7.5% |
| 2022 | -4.0% | -6.1% | -4.3% | -1.4% | -3.8% | 1.4% |
| 2023 | -7.7% | -9.5% | -4.3% | -2.7% | -5.3% | -2.3% |
| 2024 | -6.3% | -8.7% | -5.8% | -3.5% | 0.5% | -2.8% |
| 2025 | -7.4% | -11.4% | -4.9% | -2.4% | -0.2% | -2.8% |
| 2026 | -8.1% | -9.2% | -4.2% | -1.5% | 0.4% | -2.0% |
| 2027 | -7.7% | -6.7% | -3.9% | -1.6% | 0.7% | -1.6% |
| Country | 2019 | 2020 | 2024 | 2025 | 2026 | 2027 |
|---|---|---|---|---|---|---|
| Bolivia | -6.0 | -11.0 | -8.7 | -11.4 | -9.2 | -6.7 |
| Brazil | -4.9 | -11.6 | -6.3 | -7.4 | -8.1 | -7.7 |
| Colombia | -3.5 | -7.1 | -6.0 | -5.8 | -6.9 | -6.6 |
| Mexico | -2.3 | -4.3 | -5.8 | -4.9 | -4.2 | -3.9 |
| Uruguay | -2.7 | -4.6 | -3.2 | -3.4 | -4.1 | -3.4 |
| Chile | -2.7 | -7.1 | -2.8 | -2.8 | -2.0 | -1.6 |
| Peru | -1.4 | -8.2 | -3.5 | -2.4 | -1.5 | -1.6 |
| Argentina | -4.4 | -8.7 | +0.5 | -0.2 | +0.4 | +0.7 |
Source: International Monetary Fund (IMF), World Economic Outlook (WEO) October 2026, indicator "general government net lending/borrowing" (% of GDP), accessed November 16, 2026. For reference, the IMF projects a 2026 deficit of 8.5% of GDP in the United States, 5.2% on average for advanced economies and 6.0% for emerging and developing economies.
Frequently asked questions
Which Latin American country has the largest fiscal deficit?
Bolivia, with a projected deficit of 9.2% of GDP in 2026, according to the IMF. It is followed by Brazil (8.1%) and Colombia (6.9%).
Which countries have a fiscal surplus?
According to the IMF, in 2026 only Argentina and Nicaragua will close with a surplus.
What is Chile's fiscal deficit?
The IMF projects 2.0% of GDP for the general government in 2026 and 1.6% in 2027. The figure may differ from the one reported by the Finance Ministry, which measures the central government.
How often is this ranking updated?
Twice a year, with the April and October editions of the IMF World Economic Outlook. It is updated at this same URL.
How to cite this data
Vivarae News (2026). "Fiscal deficit in Latin America: ranking by country 2026". Updated November 16, 2026. Available at https://vivaraenews.com/en/fiscal-deficit-in-latin-america-ranking-by-country-2026/. The data may be reproduced by citing Vivarae News and linking to this page; each country's figures come from the International Monetary Fund.