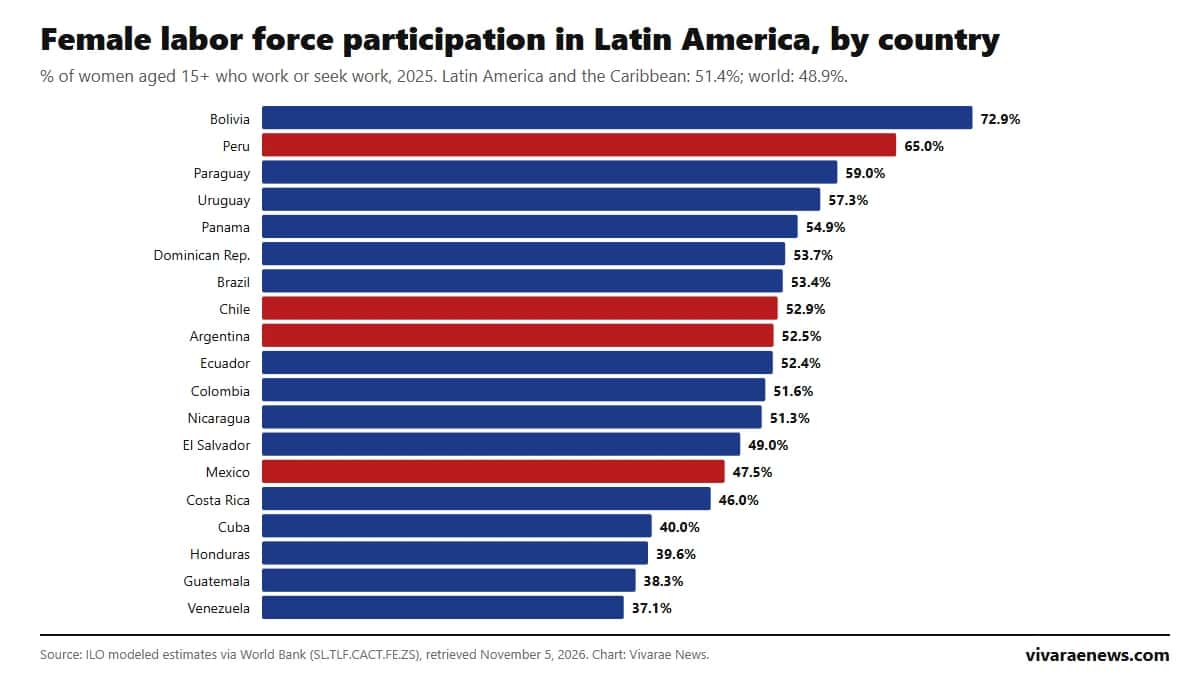
Bolivia is the Latin American country with the highest female labor force participation: 72.9% of women aged 15 or older work or are looking for work, according to the International Labour Organization (ILO) modeled estimates published by the World Bank for 2025. It is followed by Peru (65.0%) and Paraguay (59.0%). At the other end are Venezuela (37.1%), Guatemala (38.3%) and Honduras (39.6%). The Latin America and Caribbean average is 51.4%, compared with 48.9% worldwide.
Chile ranks 8th of 19, at 52.9%; Argentina 9th, at 52.5%; Mexico 14th, at 47.5%, and Peru 2nd, at 65.0%. In every country the rate for women is lower than for men: the regional gap is 23.3 points. This data sheet gathers the full ranking, the gap by country and how participation has changed since 1991. Updated November 5, 2026.
Ranking of female labor force participation in Latin America
View the data as a table
| Bolivia | 72.9% |
| Peru | 65.0% |
| Paraguay | 59.0% |
| Uruguay | 57.3% |
| Panama | 54.9% |
| Dominican Republic | 53.7% |
| Brazil | 53.4% |
| Chile | 52.9% |
| Argentina | 52.5% |
| Ecuador | 52.4% |
| Colombia | 51.6% |
| Nicaragua | 51.3% |
| El Salvador | 49.1% |
| Mexico | 47.5% |
| Costa Rica | 46.0% |
| Cuba | 40.0% |
| Honduras | 39.6% |
| Guatemala | 38.3% |
| Venezuela | 37.1% |
| Rank | Country | Women in the labor force (2025) | Men (2025) | Gap (points) |
|---|---|---|---|---|
| 1 | Bolivia | 72.9% | 84.4% | 11.6 |
| 2 | Peru | 65.0% | 80.9% | 15.8 |
| 3 | Paraguay | 59.0% | 81.6% | 22.6 |
| 4 | Uruguay | 57.3% | 73.4% | 16.1 |
| 5 | Panama | 54.9% | 77.9% | 22.9 |
| 6 | Dominican Republic | 53.7% | 76.4% | 22.7 |
| 7 | Brazil | 53.4% | 73.4% | 20.0 |
| 8 | Chile | 52.9% | 71.9% | 19.0 |
| 9 | Argentina | 52.5% | 71.7% | 19.2 |
| 10 | Ecuador | 52.4% | 76.9% | 24.5 |
| 11 | Colombia | 51.6% | 75.7% | 24.1 |
| 12 | Nicaragua | 51.3% | 81.8% | 30.5 |
| 13 | El Salvador | 49.0% | 77.3% | 28.2 |
| 14 | Mexico | 47.5% | 77.1% | 29.7 |
| 15 | Costa Rica | 46.0% | 69.8% | 23.7 |
| 16 | Cuba | 40.0% | 65.1% | 25.1 |
| 17 | Honduras | 39.6% | 73.5% | 34.0 |
| 18 | Guatemala | 38.3% | 81.7% | 43.4 |
| 19 | Venezuela | 37.1% | 67.5% | 30.4 |
Source: ILO modeled estimates (ILOEST), published by the World Bank as indicators SL.TLF.CACT.FE.ZS and SL.TLF.CACT.MA.ZS, updated October 8, 2026. The participation rate is the share of the population aged 15 or older that is employed or unemployed (looking for work). The gap is our own calculation: the men's rate minus the women's rate.
These are modeled estimates: the ILO harmonizes each country's labor surveys to make them comparable and estimates years without data, so the 2025 figure may differ from what each national statistics office publishes with its own survey. For each country's official series, go to the national survey, such as the National Employment Survey of Chile's INE.
The gender gap in female labor force participation
The widest gap is in Guatemala, at 43.4 points, and the narrowest in Bolivia, at 11.6. In Chile, the difference is 19.0 points (71.9% for men versus 52.9% for women). The chart crosses the rates for men and women in each country: the higher the dot, the more women in the labor force.
View the data as a table
| Men in the labor force | Women in the labor force | |
|---|---|---|
| Bolivia | 84% | 73% |
| Peru | 81% | 65% |
| Paraguay | 82% | 59% |
| Uruguay | 73% | 57% |
| Panama | 78% | 55% |
| Dominican Republic | 76% | 54% |
| Brazil | 73% | 53% |
| Chile | 72% | 53% |
| Argentina | 72% | 52% |
| Ecuador | 77% | 52% |
| Colombia | 76% | 52% |
| Nicaragua | 82% | 51% |
| El Salvador | 77% | 49% |
| Mexico | 77% | 47% |
| Costa Rica | 70% | 46% |
| Cuba | 65% | 40% |
| Honduras | 74% | 40% |
| Guatemala | 82% | 38% |
| Venezuela | 68% | 37% |
How female labor force participation has changed since 1991
Chile and Peru are the countries where women's participation rose the most in three decades, by about 21 points. Chile went from 31.9% in 1991 to 52.9% in 2025, an increase of 21.0 points. Mexico rose from 34.2% to 47.5%, Argentina from 44.6% to 52.5% and Peru from 43.7% to 65.0%. The pandemic left a visible drop in 2020 in every case: in Chile, the rate fell to 45.4% and only returned to pre-pandemic levels in 2024.
View the data as a table
| Chile | Mexico | Argentina | Peru | Latin America and the Caribbean | |
|---|---|---|---|---|---|
| 1991 | 31.9% | 34.2% | 44.6% | 43.7% | 42.8% |
| 1995 | 35.9% | 37.6% | 48.5% | 49.1% | 45.8% |
| 2000 | 37.7% | 38.9% | 50.5% | 53.5% | 47.6% |
| 2005 | 40.1% | 41.2% | 49.1% | 64.3% | 50.5% |
| 2010 | 46.9% | 43.0% | 47.7% | 72.0% | 51.0% |
| 2015 | 50.4% | 43.9% | 47.5% | 67.7% | 50.8% |
| 2019 | 52.7% | 45.6% | 50.0% | 70.0% | 52.1% |
| 2020 | 45.4% | 41.7% | 46.5% | 59.9% | 48.0% |
| 2021 | 46.6% | 44.6% | 50.3% | 64.8% | 50.4% |
| 2022 | 50.0% | 46.0% | 51.9% | 66.7% | 51.2% |
| 2023 | 52.0% | 47.3% | 53.0% | 65.1% | 51.2% |
| 2024 | 52.8% | 47.4% | 52.3% | 64.9% | 51.4% |
| 2025 | 52.9% | 47.5% | 52.5% | 65.0% | 51.4% |
| Country | 1991 | 2000 | 2010 | 2019 | 2020 | 2025 | Change 1991-2025 (points) |
|---|---|---|---|---|---|---|---|
| Chile | 31.9% | 37.7% | 46.9% | 52.6% | 45.4% | 52.9% | 21.0 |
| Mexico | 34.2% | 38.9% | 43.0% | 45.6% | 41.7% | 47.5% | 13.2 |
| Argentina | 44.6% | 50.5% | 47.7% | 50.0% | 46.5% | 52.5% | 7.8 |
| Peru | 43.7% | 53.5% | 72.0% | 70.0% | 59.9% | 65.0% | 21.3 |
| Latin America and the Caribbean | 42.8% | 47.6% | 51.0% | 52.1% | 48.0% | 51.4% | 8.6 |
Source: ILO via the World Bank. The race chart below shows how the countries' positions changed between 1991 and 2025:
View the data as a table
| 1991 | 1995 | 2000 | 2005 | 2010 | 2015 | 2019 | 2020 | 2021 | 2022 | 2023 | 2024 | 2025 | |
|---|---|---|---|---|---|---|---|---|---|---|---|---|---|
| Argentina | 44.6% | 48.5% | 50.5% | 49.1% | 47.7% | 47.5% | 50.0% | 46.5% | 50.3% | 51.9% | 53.0% | 52.3% | 52.5% |
| Bolivia | 56.4% | 58.2% | 59.0% | 58.3% | 57.7% | 57.0% | 66.2% | 65.0% | 71.1% | 71.7% | 72.5% | 72.4% | 72.9% |
| Brazil | 44.5% | 48.9% | 51.9% | 56.9% | 55.1% | 53.3% | 55.3% | 50.3% | 52.5% | 53.9% | 53.2% | 53.6% | 53.4% |
| Chile | 31.9% | 35.9% | 37.7% | 40.1% | 46.9% | 50.4% | 52.7% | 45.4% | 46.6% | 50.0% | 52.0% | 52.8% | 52.9% |
| Colombia | 53.1% | 54.0% | 53.4% | 51.2% | 54.4% | 55.3% | 52.4% | 51.1% | 51.7% | 50.9% | 51.8% | 51.7% | 51.6% |
| Costa Rica | 33.3% | 35.6% | 38.6% | 43.7% | 44.1% | 50.1% | 52.7% | 48.6% | 50.3% | 50.3% | 44.1% | 46.0% | 46.0% |
| Cuba | 35.4% | 33.7% | 36.3% | 39.0% | 41.9% | 44.3% | 44.7% | 42.3% | 42.4% | 41.9% | 41.2% | 40.4% | 40.0% |
| Dominican Republic | 35.4% | 37.3% | 39.7% | 39.8% | 41.7% | 48.2% | 52.5% | 47.4% | 51.1% | 50.5% | 52.5% | 53.3% | 53.7% |
| Ecuador | 47.3% | 48.0% | 45.9% | 51.9% | 48.0% | 51.9% | 54.4% | 48.2% | 53.6% | 54.2% | 52.5% | 52.4% | 52.4% |
| El Salvador | 41.0% | 43.1% | 45.4% | 45.2% | 46.0% | 45.1% | 46.0% | 43.2% | 45.2% | 46.0% | 48.5% | 49.0% | 49.1% |
| Guatemala | 44.4% | 45.2% | 46.1% | 42.0% | 41.6% | 38.4% | 37.1% | 38.3% | 42.5% | 40.5% | 38.1% | 38.4% | 38.3% |
| Honduras | 44.1% | 44.9% | 43.4% | 41.4% | 42.7% | 46.6% | 44.5% | 47.0% | 48.1% | 43.6% | 39.4% | 39.6% | 39.6% |
| Mexico | 34.2% | 37.6% | 38.9% | 41.2% | 43.0% | 43.9% | 45.6% | 41.7% | 44.6% | 46.0% | 47.3% | 47.4% | 47.5% |
| Nicaragua | 32.9% | 33.4% | 35.9% | 40.1% | 44.5% | 48.3% | 48.6% | 48.1% | 49.1% | 50.1% | 50.7% | 51.1% | 51.3% |
| Panama | 37.7% | 41.4% | 44.9% | 48.0% | 48.4% | 51.5% | 56.3% | 55.9% | 48.9% | 52.1% | 52.7% | 54.8% | 54.9% |
| Paraguay | 51.2% | 52.1% | 51.7% | 55.7% | 53.0% | 54.8% | 60.3% | 57.1% | 59.9% | 59.0% | 59.0% | 58.9% | 59.0% |
| Peru | 43.7% | 49.1% | 53.5% | 64.3% | 72.0% | 67.7% | 70.0% | 59.9% | 64.8% | 66.7% | 65.1% | 64.9% | 65.0% |
| Uruguay | 43.4% | 46.3% | 49.0% | 49.9% | 54.9% | 56.3% | 56.0% | 54.2% | 56.0% | 55.7% | 56.5% | 57.3% | 57.3% |
| Venezuela | 49.0% | 48.5% | 47.9% | 49.5% | 49.6% | 48.3% | 42.3% | 36.9% | 37.4% | 35.3% | 36.2% | 37.3% | 37.1% |
Biggest rises and falls in female labor force participation
| Country | 1991 | 2025 | Change (points) |
|---|---|---|---|
| Peru | 43.7% | 65.0% | +21.3 |
| Chile | 31.9% | 52.9% | +21.0 |
| Dominican Republic | 35.4% | 53.7% | +18.3 |
| Nicaragua | 32.9% | 51.3% | +18.3 |
| Panama | 37.7% | 54.9% | +17.3 |
| Colombia | 53.1% | 51.6% | -1.5 |
| Honduras | 44.1% | 39.6% | -4.5 |
| Guatemala | 44.4% | 38.3% | -6.1 |
| Venezuela | 49.0% | 37.1% | -11.9 |
Source: ILO via the World Bank; our own calculation of the difference between 1991 and 2025. Five countries gained more than 17 points over the period: Peru, Chile, the Dominican Republic, Nicaragua and Panama. In four, the 2025 rate is lower than in 1991: Venezuela (-11.9 points), Guatemala, Honduras and Colombia. The Latin America and Caribbean average rose 8.6 points, while the world average fell 2.2 points.

Vivarae's editions: Chile, Mexico, Argentina and Peru
| Country | Regional rank | Women (2025) | Men (2025) | Gap |
|---|---|---|---|---|
| Chile | 8 of 19 | 52.9% | 71.9% | 19.0 points |
| Mexico | 14 of 19 | 47.5% | 77.1% | 29.7 points |
| Argentina | 9 of 19 | 52.5% | 71.7% | 19.2 points |
| Peru | 2 of 19 | 65.0% | 80.9% | 15.8 points |
Peru stands out the most: at 65.0%, its women participate in the labor market more than the OECD average (53.3%). Mexico, by contrast, is below the regional average. For the other side of the labor market, see the rankings of unemployment in Latin America, youth unemployment and women in Congress.
How to cite this data
Vivarae News (2026). "Female labor force participation in Latin America: ranking by country 2026". Updated November 5, 2026. Available at https://vivaraenews.com/en/female-labor-force-participation-in-latin-america-ranking-by-country-2026/. The data may be reproduced by citing Vivarae News and linking to this page; each country's figures come from the ILO modeled estimates published by the World Bank.
Frequently asked questions
Which Latin American country has the most women in the labor market?
Bolivia, with 72.9% of women aged 15+ in the labor force in 2025, according to the ILO and the World Bank. It is followed by Peru (65.0%) and Paraguay (59.0%).
What is female labor force participation in Chile?
52.9% in 2025, according to ILO modeled estimates. It ranks 8th of 19 Latin American countries and is above the regional average (51.4%).
What is the labor force participation rate?
It is the share of the population aged 15 or older that is in the labor force, meaning they have a job or are looking for one.
Why don't these figures match those of INE or Inegi?
Because the ILO harmonizes national surveys so countries can be compared and estimates years without data. Each statistics office publishes its own rate with its own methodology and reference period.