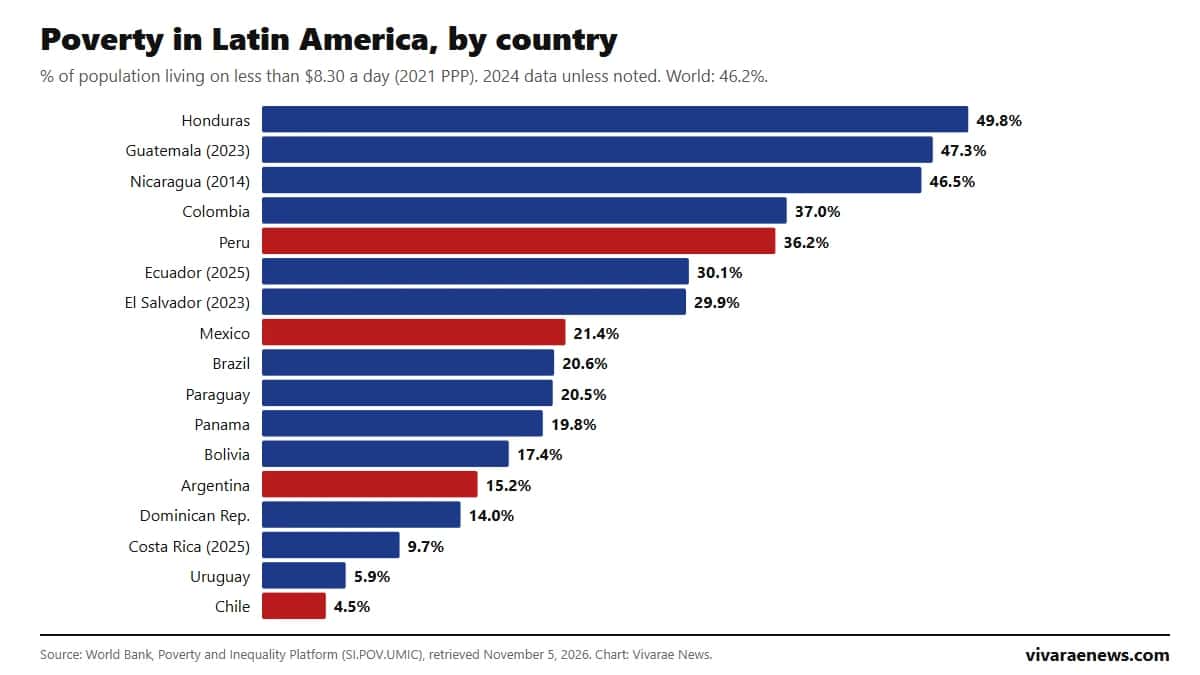
Honduras is the country with the most poverty in Latin America: 49.8% of its population lived on less than $8.30 a day in 2024, according to the World Bank Poverty and Inequality Platform. It is followed by Guatemala (47.3%, 2023 data) and Colombia (37.0%). At the other end are Chile (4.5%), Uruguay (5.9%) and Costa Rica (9.7%). The Latin America and Caribbean average is 24.7% and the world average 46.2%.
The ranking uses the line of $8.30 per person per day, in 2021 purchasing power parity (PPP) dollars, which the World Bank sets for upper-middle-income countries, the category of most of the region. It is the line that allows countries to be compared on the same threshold. Further down are extreme poverty ($3 a day) and each country's national line, which are not comparable across countries.
Poverty in Latin America ranking 2026
View the data as a table
| Latin America and the Caribbean | 24.7% |
| World | 46.2% |
| Honduras | 49.8% |
| Chile | 4.5% |
View the data as a table
| Poverty | |
|---|---|
| Honduras | 49.8% · 2024 |
| Guatemala | 47.3% · 2023 |
| Nicaragua | 46.5% · 2014 |
| Colombia | 37.0% · 2024 |
| Peru | 36.2% · 2024 |
| Ecuador | 30.1% · 2025 |
| El Salvador | 29.9% · 2023 |
| Mexico | 21.4% · 2024 |
| Brazil | 20.6% · 2024 |
| Paraguay | 20.5% · 2024 |
| Panama | 19.8% · 2024 |
| Bolivia | 17.4% · 2024 |
| Argentina | 15.2% · 2024 |
| Dominican Republic | 14.0% · 2024 |
| Costa Rica | 9.7% · 2025 |
| Uruguay | 5.9% · 2024 |
| Chile | 4.5% · 2024 |
| # | Country | Poverty ($8.30 a day) | Data year |
|---|---|---|---|
| 1 | Honduras | 49.8% | 2024 |
| 2 | Guatemala | 47.3% | 2023 |
| 3 | Nicaragua | 46.5% | 2014 |
| 4 | Colombia | 37.0% | 2024 |
| 5 | Peru | 36.2% | 2024 |
| 6 | Ecuador | 30.1% | 2025 |
| 7 | El Salvador | 29.9% | 2023 |
| 8 | Mexico | 21.4% | 2024 |
| 9 | Brazil | 20.6% | 2024 |
| 10 | Paraguay | 20.5% | 2024 |
| 11 | Panama | 19.8% | 2024 |
| 12 | Bolivia | 17.4% | 2024 |
| 13 | Argentina | 15.2% | 2024 |
| 14 | Dominican Republic | 14.0% | 2024 |
| 15 | Costa Rica | 9.7% | 2025 |
| 16 | Uruguay | 5.9% | 2024 |
| 17 | Chile | 4.5% | 2024 |
Source: World Bank, indicator SI.POV.UMIC, October 8, 2026 update, retrieved November 5, 2026. The year is that of each country's latest household survey. Nicaragua has not published comparable data since 2014, and Venezuela, Cuba and Haiti have no recent figure on this line, so they are not ranked.
What the World Bank poverty line measures
In June 2025, the World Bank updated its international lines to 2021 prices: $3 a day for extreme poverty, $4.20 for lower-middle-income countries and $8.30 for upper-middle-income countries, according to its official note. The figure is calculated from each country's household surveys and expressed in purchasing power parity, that is, adjusted for the cost of living in each place.
- $8.30 a day (SI.POV.UMIC): line for upper-middle-income countries; the basis of this ranking.
- $3 a day (SI.POV.DDAY): international extreme poverty, target 1.1 of the Sustainable Development Goals.
- National line (SI.POV.NAHC): set by each government with its own basket; useful to track one country, not to compare it with another.
Extreme poverty in Latin America by country
Using the $3-a-day line, Honduras (15.7%) is above the world average (10.1%). Guatemala (9.7%) and Colombia (8.5%) come next. Uruguay (0.2%), Chile (0.4%), Costa Rica and the Dominican Republic (0.8%) have the lowest rates, according to the World Bank. The Latin America and Caribbean average is 4.3%.
| Country | Extreme poverty ($3 a day) | Data year |
|---|---|---|
| Honduras | 15.7% | 2024 |
| Guatemala | 9.7% | 2023 |
| Colombia | 8.5% | 2024 |
| Nicaragua | 6.6% | 2014 |
| Peru | 5.1% | 2024 |
| El Salvador | 4.6% | 2023 |
| Ecuador | 3.4% | 2025 |
| Panama | 3.1% | 2024 |
| Brazil | 3.0% | 2024 |
| Paraguay | 2.1% | 2024 |
| Bolivia | 2.1% | 2024 |
| Mexico | 1.6% | 2024 |
| Argentina | 1.0% | 2024 |
| Dominican Republic | 0.8% | 2024 |
| Costa Rica | 0.8% | 2025 |
| Chile | 0.4% | 2024 |
| Uruguay | 0.2% | 2024 |
Source: World Bank, indicator SI.POV.DDAY. Extreme poverty fell in almost the entire region over the past decade, but the $3 line is very low for middle-income countries, which is why international organizations and most governments use higher thresholds to measure poverty in the region.

Poverty under each country's national line
Figures published by national statistics offices are often different because each country uses its own basket. Argentina, for example, has 15.2% poverty on the international $8.30 line but 28.2% on INDEC's line in 2025, which measures only urban areas. In the first half of 2026, INDEC reported 32.3%, as we explain in our article on basic services and poverty in Argentina. Mexico has 21.4% on the international line and 29.6% on its national one.
| Honduras | 49.8% | 15.7% | 2024 | 60.1% | 2025 |
| Guatemala | 47.3% | 9.7% | 2023 | 56.0% | 2023 |
| Nicaragua | 46.5% | 6.6% | 2014 | 24.9% | 2016 |
| Colombia | 37.0% | 8.5% | 2024 | 31.8% | 2024 |
| Peru | 36.2% | 5.1% | 2024 | 25.7% | 2025 |
| Ecuador | 30.1% | 3.4% | 2025 | 21.4% | 2025 |
| El Salvador | 29.9% | 4.6% | 2023 | 27.2% | 2023 |
| Mexico | 21.4% | 1.6% | 2024 | 29.6% | 2024 |
| Brazil | 20.6% | 3.0% | 2024 | No data | — |
| Paraguay | 20.5% | 2.1% | 2024 | 16.0% | 2025 |
| Panama | 19.8% | 3.1% | 2024 | 21.7% | 2023 |
| Bolivia | 17.4% | 2.1% | 2024 | 44.7% | 2025 |
| Argentina | 15.2% | 1.0% | 2024 | 28.2% | 2025 |
| Dominican Republic | 14.0% | 0.8% | 2024 | 17.3% | 2025 |
| Costa Rica | 9.7% | 0.8% | 2025 | 17.1% | 2025 |
| Uruguay | 5.9% | 0.2% | 2024 | 17.3% | 2024 |
| Chile | 4.5% | 0.4% | 2024 | 6.5% | 2022 |
Source: World Bank, indicators SI.POV.UMIC, SI.POV.DDAY and SI.POV.NAHC. National lines are not comparable across countries. Brazil does not report an official national line in this database. For Chile, the World Bank national figure corresponds to the 2022 Casen survey.
How poverty in Latin America has changed since 2014
The regional average fell from 33.3% in 2014 to 24.7% in 2024. The pandemic interrupted that trend in 2020, with sharp jumps in Peru (from 33.6% to 48.1%) and Colombia (from 41.8% to 48.6%). Mexico had the largest drop among the big countries: from 46.6% in 2014 to 21.4% in 2024. Brazil fell from 30.6% in 2021 to 20.6% in 2024.
View the data as a table
| Argentina | Brazil | Chile | Colombia | Mexico | Peru | Latin America & Caribbean | |
|---|---|---|---|---|---|---|---|
| 2014 | 11.7% | 26.4% | No data | 41.9% | 46.6% | 38.0% | 33.3% |
| 2015 | No data | 27.4% | 11.7% | 41.3% | No data | 37.5% | 31.6% |
| 2016 | 11.5% | 29.1% | No data | 41.4% | 37.8% | 36.4% | 31.4% |
| 2017 | 9.8% | 29.3% | 9.0% | 41.0% | No data | 37.3% | 31.0% |
| 2018 | 12.5% | 28.7% | No data | 41.1% | 35.3% | 35.2% | 30.5% |
| 2019 | 14.9% | 28.0% | No data | 41.8% | No data | 33.6% | 30.2% |
| 2020 | 18.3% | 20.8% | 11.3% | 48.6% | 36.5% | 48.1% | 30.5% |
| 2021 | 14.2% | 30.6% | No data | 44.0% | No data | 39.5% | 31.0% |
| 2022 | 13.9% | 25.3% | 6.1% | 40.2% | 27.4% | 37.8% | 28.0% |
| 2023 | 16.4% | 23.3% | No data | 39.1% | No data | 38.3% | 26.5% |
| 2024 | 15.2% | 20.6% | 4.5% | 37.0% | 21.4% | 36.2% | 24.7% |
| Country | 2014 | 2019 | 2020 | 2024 | Change 2014-2024 |
|---|---|---|---|---|---|
| Latin America & Caribbean | 33.3% | 30.2% | 30.5% | 24.7% | −8.6 points |
| Mexico | 46.6% | — | 36.5% | 21.4% | −25.2 points |
| Colombia | 41.9% | 41.8% | 48.6% | 37.0% | −4.9 points |
| Peru | 38.0% | 33.6% | 48.1% | 36.2% | −1.8 points |
| Brazil | 26.4% | 28.0% | 20.8% | 20.6% | −5.8 points |
| Argentina | 11.7% | 14.9% | 18.3% | 15.2% | +3.5 points |
| Chile | — | — | 11.3% | 4.5% | −7.2 points since 2015 (11.7%) |
Source: World Bank, SI.POV.UMIC. "—" means the country had no survey that year. In Brazil, poverty fell in 2020, the year of the pandemic, and rose to 30.6% in 2021. Argentina is the only one of these countries with more poverty in 2024 than in 2014.
Inequality matters too, but it does not explain everything. Colombia and Brazil have the region's highest Gini coefficients (54.4 and 50.3), while Chile, with a Gini of 43.0, has the lowest poverty. Peru has a lower Gini (40.1) but poverty of 36.2%, because its average income is lower. See the full ranking of inequality in Latin America by Gini coefficient.
View the data as a table
| Gini coefficient (0 to 100) | Poverty ($8.30 a day), % | |
|---|---|---|
| Honduras | 46 | 50% |
| Guatemala | 45 | 47% |
| Nicaragua | 46 | 47% |
| Colombia | 54 | 37% |
| Peru | 40 | 36% |
| Ecuador | 46 | 30% |
| El Salvador | 40 | 30% |
| Mexico | 43 | 21% |
| Brazil | 50 | 21% |
| Paraguay | 44 | 21% |
| Panama | 50 | 20% |
| Bolivia | 41 | 17% |
| Argentina | 42 | 15% |
| Dominican Republic | 39 | 14% |
| Costa Rica | 46 | 10% |
| Uruguay | 40 | 6% |
| Chile | 43 | 5% |
Poverty is tied to income and jobs. To complete the picture, compare this ranking with GDP per capita in Latin America, unemployment by country and the minimum wage in Latin America.
How to cite this data
Vivarae News (2026). "Poverty in Latin America: ranking by country 2026". Updated November 5, 2026. Available at https://vivaraenews.com/en/poverty-in-latin-america-ranking-by-country-2026/. The data may be reproduced by citing Vivarae News and linking to this page; country figures are from the World Bank (Poverty and Inequality Platform).
Frequently asked questions
Which Latin American country has the most poverty?
Honduras, with 49.8% of its population below the $8.30-a-day line in 2024, according to the World Bank. It is followed by Guatemala (47.3%) and Nicaragua (46.5%, 2014 data).
Which country has the least poverty in the region?
Chile, with 4.5%, followed by Uruguay (5.9%) and Costa Rica (9.7%).
What is poverty in Mexico, Argentina and Peru?
On the $8.30-a-day line: Mexico 21.4%, Argentina 15.2% and Peru 36.2% (2024 data).
Why don't the figures match each country's official ones?
Because each government uses its own poverty line and basket. The World Bank applies the same threshold to all so they can be compared.
How often is this ranking updated?
The World Bank updates its platform several times a year; this page is updated at the same URL when the data change.