Consumer prices in Metropolitan Lima rose 0.57% in October 2026 and inflation over the past 12 months reached 5.25%, the highest since August 2023, the National Institute of Statistics and Informatics (INEI) reported. Year-to-date inflation stands at 4.88%, and the monthly figure exceeds the October readings of the past four years.
The monthly rise came mainly from food, led by corn on the cob (+45.3%) and fish such as bonito (+26.9%), and from transport, due to airfares and fuel. Inflation has thus been above the Central Reserve Bank of Peru's (BCRP) target range of 1% to 3% since March. The full figures are below.
Peru's October 2026 inflation in figures
View the data as a table
| Annual inflation (12 months) | 5.25% |
| Monthly change | 0.57% |
| Year to date (Jan.-Oct.) | 4.88% |
| Food and beverages in the month | 1.62% |
| Indicator | October 2026 |
|---|---|
| Monthly change in the Metropolitan Lima CPI | 0.57% |
| Year-to-date inflation (Jan.-Oct.) | 4.88% |
| 12-month inflation (Nov. 2025-Oct. 2026) | 5.25% |
| Inflation excluding food and energy (monthly) | 0.16% |
| Inflation excluding food and energy (12 months) | 4.64% |
| National CPI (monthly / 12 months) | 0.56% / 4.83% |
| Wholesale price index (monthly) | 0.74% |
Source: INEI, press release of November 1, 2026; 12-month core inflation from the BCRP (series PD04722MM). INEI calculates the Metropolitan Lima CPI with a basket of 586 products: in October, 309 rose, 113 fell and 164 were unchanged.
What rose in October: food and transport
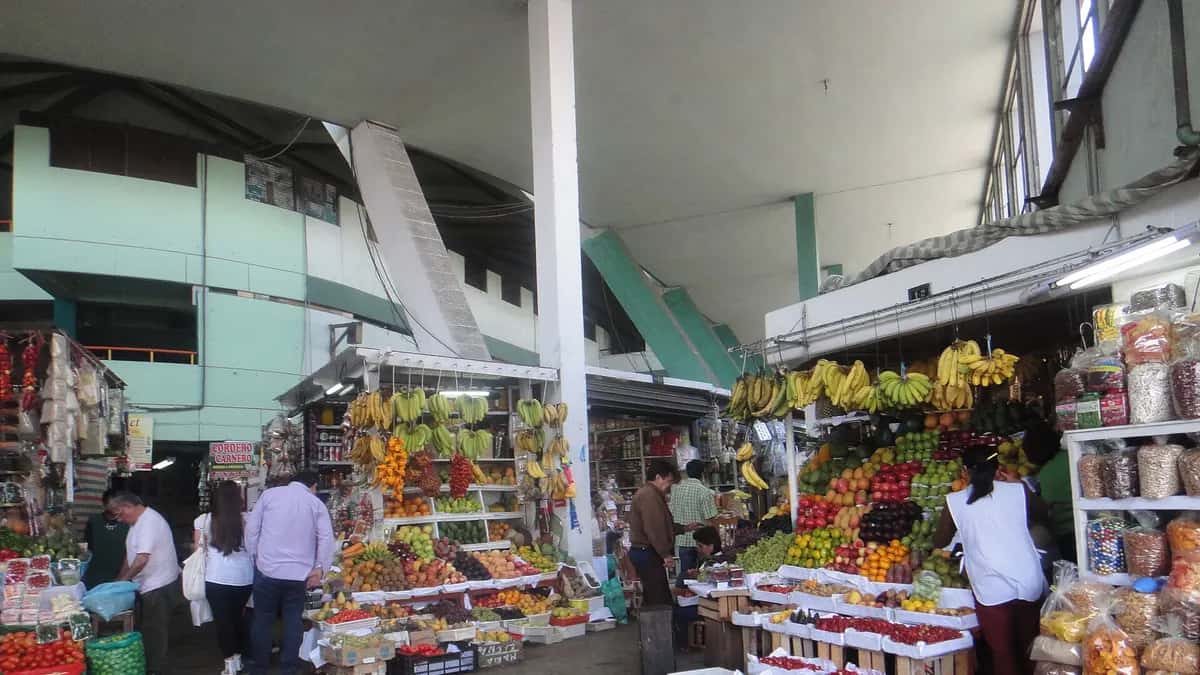
The Food and non-alcoholic beverages division rose 1.62% in the month. Fish and seafood rose 11.7%, with increases in bonito (26.9%), mackerel (17.5%) and mussels (11.2%), and vegetables and tubers rose 8.2%, led by corn on the cob (45.3%), carrots (24.6%) and green peas (24.3%). Eggs (−5.3%) and chicken fell. Transport rose 0.77% on airfares (+4.2%) and fuel (+3.6%), with increases in vehicle LPG (5.8%) and gasohol (3.8%).
| Product | Change in October |
|---|---|
| Corn on the cob | +45.29% |
| Bonito | +26.90% |
| Carrot | +24.56% |
| Green peas | +24.31% |
| Mackerel | +17.48% |
| Colored potato | +14.38% |
| Chicken eggs | −5.34% |
| Tomato | −6.80% |
| Mango | −7.72% |
| Israel apple | −10.65% |
Source: INEI. Household propane gas (0.9%) and residential electricity (0.5%) also rose, due to the new rate schedule in force since October 4. Communications fell 1.38%.
Inflation in Peru month by month in 2026
The jump in Peru's inflation began in March, when prices rose 2.38% in a single month and the annual rate went from 2.21% to 3.80%. Since then it has stayed above the top of the BCRP's target range, and in October it made another jump, from 4.55% to 5.25%. A year earlier, in October 2025, annual inflation was 1.35%.
View the data as a table
| Headline inflation | Excluding food and energy | Top of target range | |
|---|---|---|---|
| Jan. 25 | 1.85% | 2.44% | 3.00% |
| Feb. 25 | 1.48% | 2.11% | 3.00% |
| Mar. 25 | 1.28% | 1.87% | 3.00% |
| Apr. 25 | 1.65% | 1.90% | 3.00% |
| May 25 | 1.69% | 1.79% | 3.00% |
| Jun. 25 | 1.69% | 1.69% | 3.00% |
| Jul. 25 | 1.69% | 1.68% | 3.00% |
| Aug. 25 | 1.11% | 1.75% | 3.00% |
| Sept. 25 | 1.36% | 1.81% | 3.00% |
| Oct. 25 | 1.35% | 1.77% | 3.00% |
| Nov. 25 | 1.37% | 1.77% | 3.00% |
| Dec. 25 | 1.51% | 1.83% | 3.00% |
| Jan. 26 | 1.70% | 2.02% | 3.00% |
| Feb. 26 | 2.21% | 2.20% | 3.00% |
| Mar. 26 | 3.80% | 3.65% | 3.00% |
| Apr. 26 | 4.01% | 4.41% | 3.00% |
| May 26 | 3.91% | 4.44% | 3.00% |
| Jun. 26 | 4.01% | 4.46% | 3.00% |
| Jul. 26 | 4.07% | 4.57% | 3.00% |
| Aug. 26 | 4.44% | 4.50% | 3.00% |
| Sept. 26 | 4.55% | 4.51% | 3.00% |
| Oct. 26 | 5.25% | 4.64% | 3.00% |
| Month | Monthly change | 12-month change | Excluding food and energy (12 months) |
|---|---|---|---|
| Jan. 26 | 0.10% | 1.70% | 2.02% |
| Feb. 26 | 0.69% | 2.21% | 2.20% |
| Mar. 26 | 2.38% | 3.80% | 3.65% |
| Apr. 26 | 0.52% | 4.01% | 4.41% |
| May 26 | -0.16% | 3.91% | 4.44% |
| Jun. 26 | 0.23% | 4.01% | 4.46% |
| Jul. 26 | 0.29% | 4.07% | 4.57% |
| Aug. 26 | 0.07% | 4.44% | 4.50% |
| Sept. 26 | 0.12% | 4.55% | 4.51% |
| Oct. 26 | 0.57% | 5.25% | 4.64% |
Source: BCRP, series PN01271PM, PN01273PM and PD04722MM, compiled with INEI data. The BCRP's target is 2% inflation with a tolerance of one percentage point above or below.
Why inflation is rising in Peru: El Niño and fuel
INEI attributes October's rise to the prices of fish, vegetables and tubers, and to fuel. Several outlets, such as Infobae and El Nuevo Herald, link the higher food prices to the coastal El Niño, which the ENFEN keeps at extraordinary magnitude and which affects fishing and harvests. The BCRP already estimated the phenomenon would cut growth: we explain it in our story on El Niño and GDP and in what the ENFEN says.
Core inflation, which excludes food and energy, rose 0.16% in the month and stands at 4.64% over 12 months, also above the target range. It is the indicator the central bank watches most closely when setting its rate, which remains at 4.25%.

The cities with the highest inflation in October
All 26 cities where INEI calculates the CPI recorded increases in October. The largest were Huancavelica (1.03%), Cerro de Pasco (0.96%), Puerto Maldonado (0.92%), Puno (0.78%) and Huaraz (0.77%); the smallest, Pucallpa (0.07%), Tumbes (0.10%) and Tacna (0.15%).
View the data as a table
| Huancavelica | 1.03% |
| Cerro de Pasco | 0.96% |
| Puerto Maldonado | 0.92% |
| Puno | 0.78% |
| Huaraz | 0.77% |
| Lima | 0.57% |
| Huánuco | 0.26% |
| Chachapoyas | 0.25% |
| Tacna | 0.15% |
| Tumbes | 0.10% |
| Pucallpa | 0.07% |
What 5.25% inflation means for the BCRP
The Central Reserve Bank keeps its policy rate at 4.25%, the same level as a year ago, according to its statistical series. With inflation at 5.25%, the policy rate is now below the rise in prices: in real terms, after inflation, it is negative. For the BCRP, the key question is whether the rise comes from temporary supply shocks, such as El Niño's effect on fishing and harvests or fuel prices, or whether it spreads to other prices: that is why it closely tracks inflation excluding food and energy and expectations.
| Indicator | Value | Source |
|---|---|---|
| BCRP policy rate | 4.25% | BCRP |
| Inflation target range | 1% to 3% | BCRP |
| Headline 12-month inflation (Lima) | 5.25% | INEI |
| 12-month inflation excluding food and energy | 4.64% | BCRP |
| National 12-month inflation | 4.83% | INEI |
The BCRP had not announced a new rate decision at the time of writing; its next monetary program will be released in November. For household budgets, the figure matters because adjustments such as the minimum wage or the December bonus are measured against prices already rising more than 5% a year.
How Peru compares with the rest of the region is in the Latin America inflation ranking and the one on interest rates by country.
Frequently asked questions
What was Peru's inflation in October 2026?
In Metropolitan Lima, 0.57% in the month and 5.25% over 12 months, according to INEI. Nationally, 0.56% and 4.83%.
Is it the highest inflation in how long?
The 12-month rate of 5.25% is the highest since August 2023, when it reached 5.58%, according to the BCRP series.
What is the BCRP's inflation target?
A range of 1% to 3%, centered on 2%. Inflation has been above that range since March 2026.
Which products rose the most?
Corn on the cob (45.29%), bonito (26.90%), carrots (24.56%), green peas (24.31%) and mackerel (17.48%).
When is the November figure released?
INEI publishes price changes on the first day of the following month: the November figure will come out on December 1, 2026.