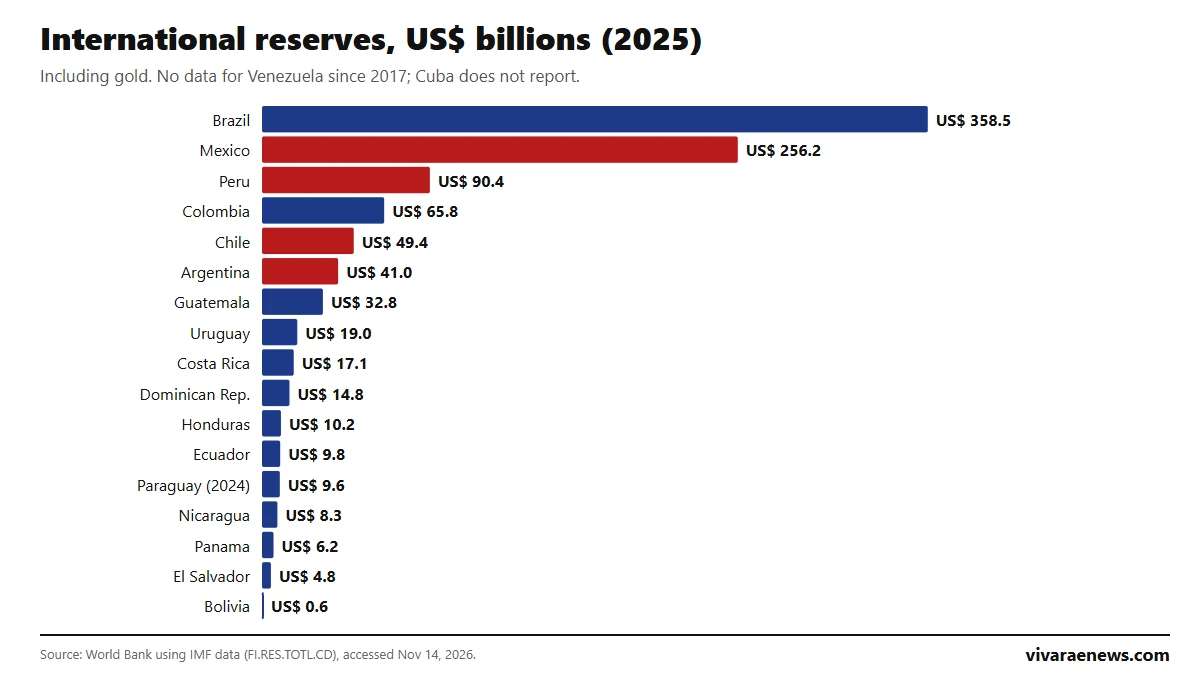
Brazil has the largest international reserves in Latin America: US$ 358,513 million at the end of 2025, according to the World Bank. It is followed by Mexico (US$ 256,179 million), Peru (US$ 90,394 million), Colombia (US$ 65,806 million) and Chile (US$ 49,450 million), which ranks 5 of 17. Argentina, with US$ 40,999 million, is sixth. The 17 countries with recent data hold about US$ 994 billion combined, and Brazil and Mexico account for 62%.
International reserves are the foreign currency and gold assets each country's central bank holds to pay for imports and debts and defend its currency in a crisis. This ranking of international reserves in Latin America compares them in dollars, as a percentage of GDP and in months of imports, and is updated on this same page when the World Bank publishes new data.
View the data as a table
| Brazil | US$ 358.5 B |
| Mexico | US$ 256.2 B |
| Chile | US$ 49.4 B |
| Peru, reserves as % of GDP | 27.0% |
Ranking of international reserves in Latin America
| Rank | Country | Reserves (US$ million) | % of GDP | Months of imports | Year |
|---|---|---|---|---|---|
| 1 | Brazil | 358,513 | 15.7 | 8.4 | 2025 |
| 2 | Mexico | 256,179 | 14.0 | 3.7 | 2025 |
| 3 | Peru | 90,394 | 27.0 | 10.4 | 2025 |
| 4 | Colombia | 65,806 | 14.4 | 7.3 | 2025 |
| 5 | Chile | 49,450 | 13.8 | 4.2 | 2025 |
| 6 | Argentina | 40,999 | 6.0 | 4.0 | 2025 |
| 7 | Guatemala | 32,754 | 26.6 | 9.3 | 2025 |
| 8 | Uruguay | 18,987 | 22.2 | 8.6 | 2025 |
| 9 | Costa Rica | 17,086 | 16.6 | 4.7 | 2025 |
| 10 | Dominican Rep. | 14,779 | 11.6 | 4.0 | 2025 |
| 11 | Honduras | 10,204 | 25.8 | 5.3 | 2025 |
| 12 | Ecuador | 9,798 | 7.5 | 2.8 | 2025 |
| 13 | Paraguay | 9,568 | 21.4 | 5.5 | 2024 |
| 14 | Nicaragua | 8,324 | 37.4 | - | 2025 |
| 15 | Panama | 6,241 | 6.9 | 1.7 | 2025 |
| 16 | El Salvador | 4,816 | 13.1 | 2.5 | 2025 |
| 17 | Bolivia | 580 | 0.9 | 0.5 | 2025 |
Source: World Bank, using IMF data (FI.RES.TOTL.CD, total reserves including gold), accessed November 14, 2026; % of GDP, Vivarae News calculation using World Bank GDP in current dollars (NY.GDP.MKTP.CD); months of imports, indicator FI.RES.TOTL.MO. 2025 data; Paraguay, 2024. Venezuela has no data since 2017 and Cuba does not report. World Bank figures may differ from those published by each central bank, which use other cut-off dates or exclude gold.
View the data as a table
| Brazil | US$ 358.5 · 2025 |
| Mexico | US$ 256.2 · 2025 |
| Peru | US$ 90.4 · 2025 |
| Colombia | US$ 65.8 · 2025 |
| Chile | US$ 49.4 · 2025 |
| Argentina | US$ 41.0 · 2025 |
| Guatemala | US$ 32.8 · 2025 |
| Uruguay | US$ 19.0 · 2025 |
| Costa Rica | US$ 17.1 · 2025 |
| Dominican Republic | US$ 14.8 · 2025 |
| Honduras | US$ 10.2 · 2025 |
| Ecuador | US$ 9.8 · 2025 |
| Paraguay | US$ 9.6 · 2024 |
| Nicaragua | US$ 8.3 · 2025 |
| Panama | US$ 6.2 · 2025 |
| El Salvador | US$ 4.8 · 2025 |
| Bolivia | US$ 0.6 · 2025 |

International reserves as a percentage of GDP
Relative to the size of the economy, the order changes. Nicaragua leads with reserves equal to 37.4% of its GDP, followed by Peru (27.0%), Guatemala (26.6%) and Honduras (25.8%). Brazil has 15.7%, Mexico 14.0% and Chile 13.8%. At the other end are Bolivia (0.9%) and Argentina (6.0%).
How many months of imports reserves cover
Another way to measure them is how many months of imports a country could pay for with its reserves alone. A traditional rule of thumb uses three months as a minimum benchmark. Peru covers 10.4 months, Guatemala 9.3 and Uruguay 8.6. Chile covers 4.2, Mexico 3.7 and Argentina 4.0. Bolivia, with 0.5 months, is far below that threshold, as are Panama, El Salvador and Ecuador, three economies that use the dollar as their currency.

How international reserves have changed since 2005
The region's reserves multiplied over two decades. Brazil went from US$ 53,799 million in 2005 to US$ 358,513 million in 2025; Mexico from US$ 74,110 million to US$ 256,179 million; and Peru from US$ 14,171 million to US$ 90,394 million. Chile nearly tripled its reserves, from US$ 16,933 million. Bolivia went the other way: it had US$ 13,050 million in 2015 and has US$ 580 million left. Argentina, which fell to US$ 23,081 million in 2023, recovered to US$ 40,999 million in 2025.
View the data as a table
| Peru | Colombia | Chile | Argentina | Bolivia | |
|---|---|---|---|---|---|
| 2005 | 14.2 | 15.0 | 16.9 | 28.1 | 1.8 |
| 2008 | 31.2 | 23.7 | 23.1 | 46.4 | 7.7 |
| 2010 | 44.2 | 28.1 | 27.8 | 52.2 | 9.7 |
| 2015 | 61.6 | 46.2 | 38.6 | 25.5 | 13.0 |
| 2019 | 68.4 | 52.7 | 40.7 | 44.9 | 6.5 |
| 2020 | 75.0 | 58.5 | 39.2 | 39.4 | 5.2 |
| 2021 | 78.6 | 58.0 | 51.3 | 39.7 | 4.7 |
| 2022 | 72.3 | 56.7 | 39.1 | 44.8 | 3.8 |
| 2023 | 71.4 | 59.0 | 46.4 | 23.1 | 1.8 |
| 2024 | 79.2 | 61.9 | 44.4 | 29.6 | 2.0 |
| 2025 | 90.4 | 65.8 | 49.4 | 41.0 | 0.6 |
| Country | 2005 | 2010 | 2019 | 2021 | 2023 | 2025 |
|---|---|---|---|---|---|---|
| Brazil | 53,799 | 288,575 | 356,886 | 362,210 | 355,021 | 358,513 |
| Mexico | 74,110 | 120,584 | 183,056 | 207,799 | 214,317 | 256,179 |
| Peru | 14,171 | 44,215 | 68,440 | 78,590 | 71,394 | 90,394 |
| Colombia | 14,955 | 28,076 | 52,653 | 58,019 | 59,041 | 65,806 |
| Chile | 16,933 | 27,827 | 40,656 | 51,252 | 46,377 | 49,450 |
| Argentina | 28,082 | 52,208 | 44,881 | 39,653 | 23,081 | 40,999 |
| Bolivia | 1,795 | 9,731 | 6,455 | 4,730 | 1,800 | 580 |
Source: World Bank, using IMF data (FI.RES.TOTL.CD, total reserves including gold), accessed November 14, 2026; table figures in millions of dollars. Brazil and Mexico are left out of the line chart because their scale would flatten the rest. Mexico has just reduced its IMF credit line because its reserves already cover it several times over: read why the IMF cut Mexico's flexible credit line. For monetary context, see the rankings of Latin American currencies against the dollar and external debt.
Frequently asked questions
Which Latin American country has the most international reserves?
Brazil, with US$ 358,513 million at the end of 2025, according to the World Bank.
How much in international reserves does Chile have?
US$ 49,450 million at the end of 2025, 13.8% of GDP and 4.2 months of imports.
What are international reserves for?
To pay for imports and external debts if financing is cut off, intervene in the foreign exchange market and give investors confidence.
How often is this ranking updated?
When the World Bank publishes new annual data. It is updated at this same URL.
How to cite this data
Vivarae News (2026). "International reserves in Latin America: ranking by country 2026". Updated November 14, 2026. Available at https://vivaraenews.com/en/international-reserves-in-latin-america-ranking-by-country-2026/. The data may be reproduced by citing Vivarae News and linking to this page; each country's figures come from the World Bank, using IMF data.