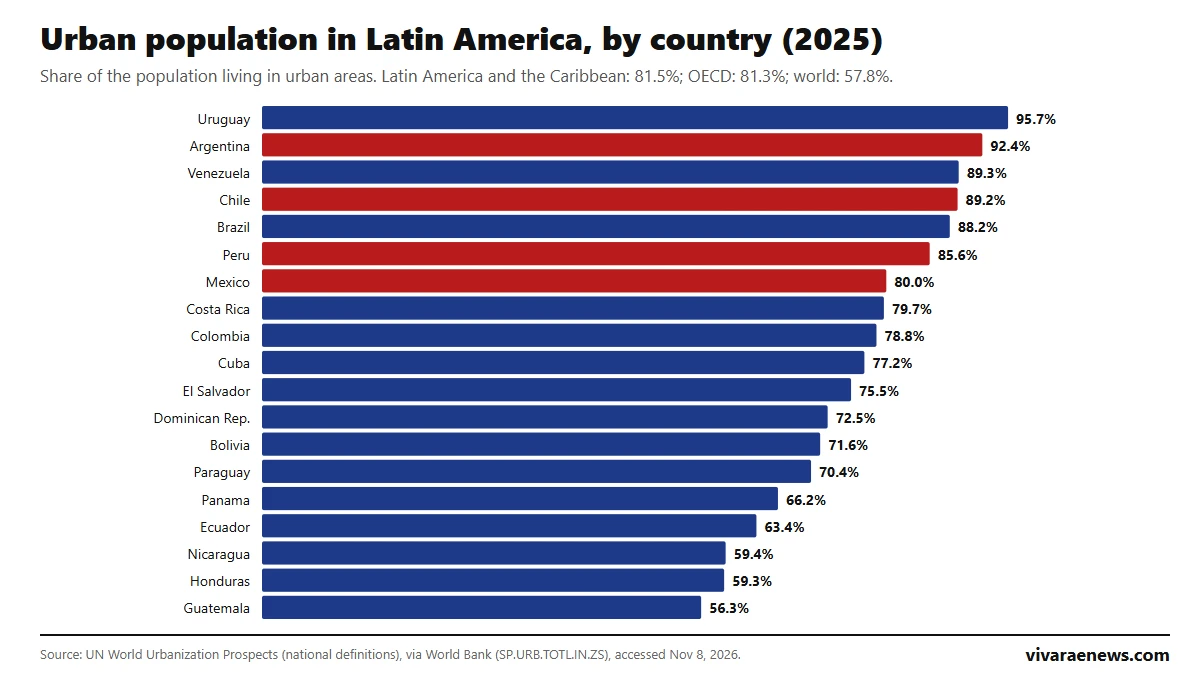
Uruguay is the most urbanized country in Latin America: 95.7% of its population lived in urban areas in 2025, followed by Argentina (92.4%), Venezuela (89.3%) and Chile (89.2%), according to UN estimates published by the UN via the World Bank. Latin America and the Caribbean reached 81.5%, above the OECD average (81.3%) and far above the world (57.8%). 543 million people in the region live in cities.
The indicator measures the share of the population living in urban areas as defined by each country, compiled and smoothed by the UN Population Division in its World Urbanization Prospects. Because each statistics office defines "urban" in its own way, cross-country comparisons have a margin. This ranking covers 19 countries and complements our ranking of Latin America's population.
View the data as a table
| Uruguay, the most urban | 95.7% |
| Latin America and the Caribbean | 81.5% |
| Urban residents in the region | 543 million |
| Guatemala, the least urban | 56.3% |
Ranking of urban population in Latin America (2025)
| Rank | Country | Urban population (%) | Urban residents |
|---|---|---|---|
| 1 | Uruguay | 95.7% | 3.2 million |
| 2 | Argentina | 92.4% | 42.3 million |
| 3 | Venezuela | 89.3% | 25.5 million |
| 4 | Chile | 89.2% | 17.7 million |
| 5 | Brazil | 88.2% | 187.7 million |
| 6 | Peru | 85.6% | 29.6 million |
| 7 | Mexico | 80.0% | 105.6 million |
| 8 | Costa Rica | 79.7% | 4.1 million |
| 9 | Colombia | 78.8% | 42.1 million |
| 10 | Cuba | 77.2% | 8.4 million |
| 11 | El Salvador | 75.5% | 4.8 million |
| 12 | Dominican Republic | 72.5% | 8.4 million |
| 13 | Bolivia | 71.6% | 9.0 million |
| 14 | Paraguay | 70.4% | 4.9 million |
| 15 | Panama | 66.2% | 3.0 million |
| 16 | Ecuador | 63.4% | 11.6 million |
| 17 | Nicaragua | 59.4% | 4.2 million |
| 18 | Honduras | 59.3% | 6.5 million |
| 19 | Guatemala | 56.3% | 10.5 million |
Source: UN via the World Bank, indicators SP.URB.TOTL.IN.ZS and SP.URB.TOTL, last updated October 8, 2026, accessed November 8, 2026. 2025 data.
View the data as a table
| Uruguay | 95.7% |
| Argentina | 92.4% |
| Venezuela | 89.3% |
| Chile | 89.2% |
| Brazil | 88.2% |
| Peru | 85.6% |
| Mexico | 80.0% |
| Costa Rica | 79.7% |
| Colombia | 78.8% |
| Cuba | 77.2% |
| El Salvador | 75.5% |
| Dominican Republic | 72.5% |
| Bolivia | 71.6% |
| Paraguay | 70.4% |
| Panama | 66.2% |
| Ecuador | 63.4% |
| Nicaragua | 59.4% |
| Honduras | 59.3% |
| Guatemala | 56.3% |
The map shows a Southern Cone that is almost entirely urban, with Uruguay, Argentina and Chile above 89%, and a Central America where much of the population still lives in rural areas: Guatemala (56.3%), Honduras (59.3%) and Nicaragua (59.4%) are at the bottom. Brazil, with 187.7 million urban residents, has the most people living in cities in absolute terms, followed by Mexico (105.6 million).
For Vivarae's four editions: Argentina is second, Chile fourth, Peru sixth at 85.6% and Mexico seventh at 80.0%, just below the regional average. Chile has 17.7 million urban residents; for its total population, see how many people live in Chile.
How Latin America's urban population has grown since 1960
View the data as a table
| Chile | Argentina | Mexico | Peru | Brazil | Guatemala | Latin America and the Caribbean | World | |
|---|---|---|---|---|---|---|---|---|
| 1960 | 67.8% | 71.7% | 50.8% | 46.7% | 44.7% | 31.9% | 48.9% | 34.2% |
| 1965 | 71.8% | 75.4% | 55.0% | 51.6% | 48.7% | 34.1% | 52.5% | 35.4% |
| 1970 | 75.3% | 78.8% | 59.0% | 57.7% | 53.2% | 36.0% | 56.5% | 36.5% |
| 1975 | 78.8% | 81.0% | 62.9% | 61.8% | 60.3% | 35.7% | 61.0% | 37.7% |
| 1980 | 81.7% | 82.9% | 66.3% | 64.7% | 67.4% | 32.8% | 65.2% | 39.5% |
| 1985 | 82.7% | 85.0% | 69.1% | 67.0% | 71.6% | 33.0% | 68.2% | 41.4% |
| 1990 | 83.2% | 86.9% | 71.5% | 68.9% | 74.9% | 33.9% | 70.8% | 42.8% |
| 1995 | 84.4% | 88.2% | 73.3% | 70.9% | 77.7% | 35.8% | 73.0% | 44.3% |
| 2000 | 86.3% | 89.2% | 74.9% | 72.8% | 81.2% | 43.2% | 75.6% | 46.8% |
| 2005 | 86.8% | 90.1% | 76.5% | 74.8% | 83.0% | 48.1% | 77.3% | 49.4% |
| 2010 | 87.0% | 91.0% | 76.5% | 77.4% | 84.3% | 51.3% | 78.4% | 51.8% |
| 2015 | 87.5% | 91.5% | 77.2% | 80.7% | 85.7% | 53.4% | 79.4% | 54.4% |
| 2020 | 88.3% | 91.9% | 78.7% | 83.5% | 86.9% | 54.6% | 80.4% | 56.4% |
| 2025 | 89.2% | 92.4% | 80.0% | 85.6% | 88.2% | 56.3% | 81.5% | 57.8% |
In 1960, fewer than half of Latin Americans lived in cities: 48.9%. The region crossed 50% in 1962, 45 years before the world did in 2007. Brazil went from 44.7% to 88.2%, and Peru from 46.7% to 85.6%. Chile, already highly urban in 1960 (67.8%), gained 21.3 points. The region first overtook the OECD average in 2001 and has stayed just above it since. The race shows how positions changed every five years:
View the data as a table
| 1960 | 1965 | 1970 | 1975 | 1980 | 1985 | 1990 | 1995 | 2000 | 2005 | 2010 | 2015 | 2020 | 2025 | |
|---|---|---|---|---|---|---|---|---|---|---|---|---|---|---|
| Uruguay | 80.2 | 81.2 | 82.0 | 83.0 | 85.0 | 87.2 | 89.1 | 90.6 | 91.3 | 92.1 | 94.3 | 95.1 | 95.4 | 95.7 |
| Argentina | 71.7 | 75.4 | 78.8 | 81.0 | 82.9 | 85.0 | 86.9 | 88.2 | 89.2 | 90.1 | 91.0 | 91.5 | 91.9 | 92.4 |
| Venezuela | 61.9 | 66.9 | 71.9 | 75.9 | 79.2 | 81.8 | 84.0 | 86.4 | 88.2 | 88.6 | 88.8 | 89.0 | 89.1 | 89.3 |
| Chile | 67.8 | 71.8 | 75.3 | 78.8 | 81.7 | 82.7 | 83.2 | 84.4 | 86.3 | 86.8 | 87.0 | 87.5 | 88.3 | 89.2 |
| Brazil | 44.7 | 48.7 | 53.2 | 60.3 | 67.4 | 71.6 | 74.9 | 77.7 | 81.2 | 83.0 | 84.3 | 85.7 | 86.9 | 88.2 |
| Peru | 46.7 | 51.6 | 57.7 | 61.8 | 64.7 | 67.0 | 68.9 | 70.9 | 72.8 | 74.8 | 77.4 | 80.7 | 83.5 | 85.6 |
| Mexico | 50.8 | 55.0 | 59.0 | 62.9 | 66.3 | 69.1 | 71.5 | 73.3 | 74.9 | 76.5 | 76.5 | 77.2 | 78.7 | 80.0 |
| Costa Rica | 34.1 | 35.2 | 38.8 | 41.4 | 42.9 | 44.9 | 48.6 | 53.6 | 59.1 | 64.9 | 71.5 | 75.0 | 77.5 | 79.7 |
| Colombia | 48.1 | 53.0 | 58.2 | 62.1 | 64.7 | 67.1 | 69.5 | 71.8 | 74.4 | 76.0 | 76.7 | 77.2 | 77.6 | 78.8 |
| Cuba | 57.7 | 58.8 | 60.3 | 63.9 | 68.4 | 71.1 | 73.7 | 74.6 | 75.6 | 76.0 | 76.6 | 76.9 | 77.1 | 77.2 |
| El Salvador | 38.4 | 38.9 | 39.4 | 40.6 | 42.8 | 45.7 | 49.0 | 52.4 | 56.6 | 61.0 | 65.4 | 69.7 | 73.1 | 75.5 |
| Dominican Republic | 30.2 | 34.9 | 40.3 | 46.3 | 51.5 | 53.7 | 55.0 | 57.1 | 61.3 | 67.6 | 74.2 | 74.1 | 73.3 | 72.5 |
| Bolivia | 36.9 | 37.9 | 39.2 | 40.8 | 44.1 | 50.1 | 55.9 | 59.4 | 61.9 | 64.2 | 66.4 | 68.4 | 70.0 | 71.6 |
| Paraguay | 35.6 | 36.2 | 37.0 | 38.5 | 41.4 | 45.2 | 50.1 | 54.1 | 57.5 | 58.9 | 59.5 | 61.3 | 66.1 | 70.4 |
| Panama | 41.3 | 44.5 | 47.6 | 48.7 | 49.8 | 51.5 | 53.9 | 58.3 | 62.2 | 64.1 | 65.1 | 65.5 | 65.8 | 66.2 |
| Ecuador | 34.7 | 37.3 | 39.3 | 42.1 | 47.0 | 51.4 | 55.1 | 58.2 | 60.7 | 62.0 | 62.7 | 63.0 | 63.1 | 63.4 |
| Nicaragua | 39.2 | 42.6 | 47.3 | 49.5 | 51.1 | 52.4 | 53.5 | 54.5 | 55.2 | 55.9 | 56.8 | 57.8 | 58.7 | 59.4 |
| Honduras | 23.4 | 24.7 | 28.6 | 32.1 | 35.1 | 37.9 | 40.5 | 42.9 | 45.3 | 48.2 | 51.3 | 54.4 | 56.9 | 59.3 |
| Guatemala | 31.9 | 34.1 | 36.0 | 35.7 | 32.8 | 33.0 | 33.9 | 35.8 | 43.2 | 48.1 | 51.3 | 53.4 | 54.6 | 56.3 |
| Country | 1960 | 1990 | 2010 | 2025 |
|---|---|---|---|---|
| Uruguay | 80.2% | 89.1% | 94.3% | 95.7% |
| Argentina | 71.7% | 86.9% | 91.0% | 92.3% |
| Chile | 67.8% | 83.2% | 87.0% | 89.2% |
| Brazil | 44.7% | 74.9% | 84.3% | 88.2% |
| Peru | 46.7% | 68.9% | 77.4% | 85.6% |
| Mexico | 50.8% | 71.5% | 76.5% | 80.0% |
| Guatemala | 31.9% | 33.9% | 51.3% | 56.3% |
| Latin America and the Caribbean | 48.9% | 70.8% | 78.4% | 81.5% |
| World | 34.2% | 42.8% | 51.8% | 57.8% |
Source: UN via the World Bank, SP.URB.TOTL.IN.ZS. Uruguay has led in every period since 1960. Brazil made the biggest jump between 1960 and 1980: from 44.7% to 67.4% in 20 years.
Which Latin American countries have urbanized most since 1990
Costa Rica is the most striking case: it went from 48.6% urban population in 1990 to 79.7% in 2025, 31.2 points more. It is followed by El Salvador (+26.5) and Guatemala (+22.4). Countries that were already highly urban grew little: Cuba added 3.5 points, Argentina 5.4 and Chile 6.0.
Urban population and income per person in Latin America
View the data as a table
| GDP per capita 2025 (US$) | Urban population (%) | |
|---|---|---|
| Uruguay | 25,216.0 | 95.7% |
| Argentina | 14,898.0 | 92.4% |
| Venezuela | 3,495.0 | 89.3% |
| Chile | 17,995.0 | 89.2% |
| Brazil | 10,713.0 | 88.2% |
| Peru | 9,684.0 | 85.6% |
| Mexico | 13,889.0 | 80.0% |
| Costa Rica | 19,970.0 | 79.7% |
| Colombia | 8,562.0 | 78.8% |
| Cuba | 9,605.0 | 77.2% |
| El Salvador | 5,767.0 | 75.5% |
| Dominican Republic | 11,059.0 | 72.5% |
| Bolivia | 5,148.0 | 71.6% |
| Paraguay | 7,027.0 | 70.4% |
| Panama | 19,790.0 | 66.2% |
| Ecuador | 7,125.0 | 63.4% |
| Nicaragua | 3,173.0 | 59.4% |
| Honduras | 3,598.0 | 59.3% |
| Guatemala | 6,598.0 | 56.3% |
More urban countries tend to have higher incomes, but there are exceptions. Venezuela, with GDP per capita of US$3,495 in 2025, is as urban as Chile (US$17,995). Panama and Costa Rica, with incomes similar to Chile's, have 66.2% and 79.7% urban population. For the income ranking, see GDP per capita in Latin America.
How much of the urban population lives in the largest city
| Uruguay | 95.7 | 3.2 | 55.2 | 25,216 |
| Argentina | 92.4 | 42.3 | 37.2 | 14,898 |
| Venezuela | 89.3 | 25.5 | 11.8 | 3,495 |
| Chile | 89.2 | 17.7 | 39.5 | 17,995 |
| Brazil | 88.2 | 187.7 | 12.3 | 10,713 |
| Peru | 85.6 | 29.6 | 38.9 | 9,684 |
| Mexico | 80.0 | 105.6 | 21.5 | 13,889 |
| Costa Rica | 79.7 | 4.1 | 36.6 | 19,970 |
| Colombia | 78.8 | 42.1 | 28.0 | 8,562 |
| Cuba | 77.2 | 8.4 | 25.5 | 9,605 |
| El Salvador | 75.5 | 4.8 | 23.6 | 5,767 |
| Dominican Republic | 72.5 | 8.4 | 43.7 | 11,059 |
| Bolivia | 71.6 | 9.0 | 22.2 | 5,148 |
| Paraguay | 70.4 | 4.9 | 73.5 | 7,027 |
| Panama | 66.2 | 3.0 | 67.9 | 19,790 |
| Ecuador | 63.4 | 11.6 | 28.0 | 7,125 |
| Nicaragua | 59.4 | 4.2 | 26.9 | 3,173 |
| Honduras | 59.3 | 6.5 | 25.3 | 3,598 |
| Guatemala | 56.3 | 10.5 | 30.7 | 6,598 |
Concentration in a single city varies widely. In Paraguay, 73.5% of the urban population lives in the Asunción metropolitan area; in Panama, 67.9% is in the capital, and in Uruguay, 55.2% in Montevideo. In Chile, Greater Santiago holds 39.5% and in Peru, Lima 38.9%. Brazil (12.3%) and Mexico (21.5%) have more spread-out urban networks. Source: World Bank, EN.URB.LCTY.UR.ZS.
| Country | % of urban population in the largest city (2025) |
|---|---|
| Paraguay | 73.5% |
| Panama | 67.9% |
| Uruguay | 55.2% |
| Chile | 39.5% |
| Peru | 38.9% |
| Argentina | 37.2% |
| Mexico | 21.5% |
| Brazil | 12.3% |
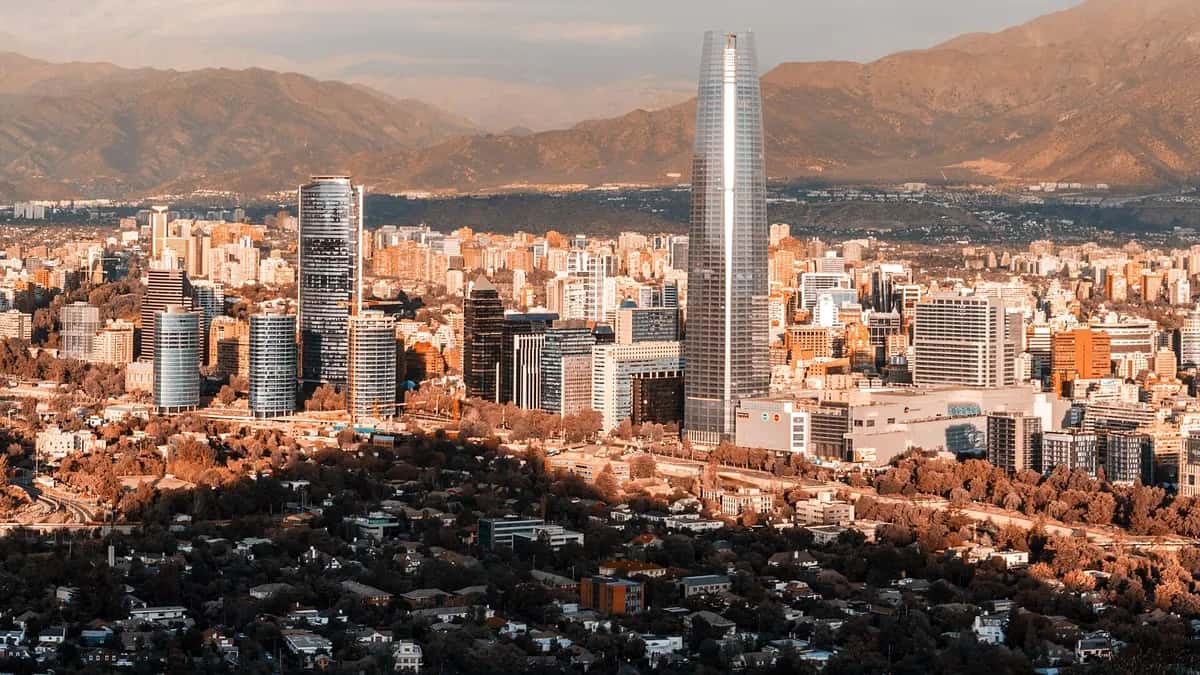
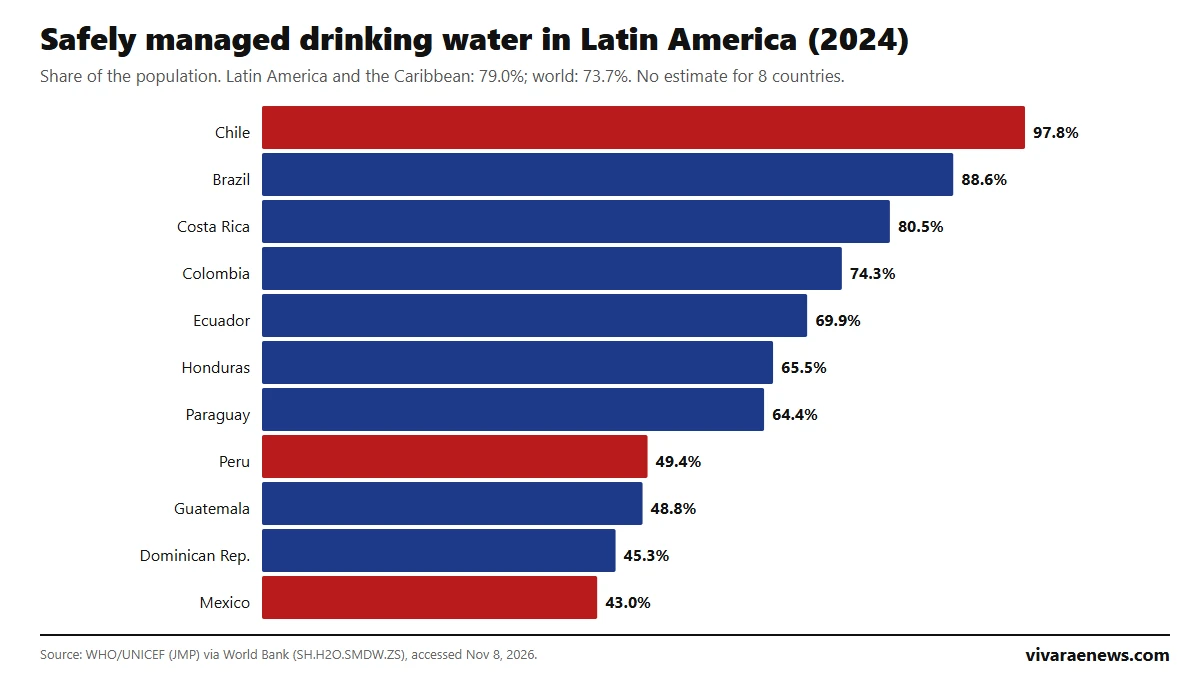
Access to basic services in those cities is measured in our ranking of drinking water in Latin America.
How to cite this data
Vivarae News (2026). "Urban population in Latin America: ranking by country 2026". Updated November 8, 2026. Available at https://vivaraenews.com/en/urban-population-in-latin-america-ranking-by-country-2026/. The data may be reproduced by citing Vivarae News and linking to this page; each country's figures come from the UN World Urbanization Prospects, published by the World Bank.
Frequently asked questions
Which is the most urban country in Latin America?
Uruguay, with 95.7% of its population in urban areas in 2025, according to the UN via the World Bank. It is followed by Argentina (92.4%) and Venezuela (89.3%).
What share of Chile's population is urban?
89.2% in 2025, or 17.7 million people. Chile is the region's fourth most urban country.
Which is the least urban country in the region?
Guatemala, at 56.3%, followed by Honduras (59.3%) and Nicaragua (59.4%).
What share of Latin America lives in cities?
81.5% in 2025, compared with 57.8% worldwide and 81.3% in the OECD.
Why are the data not fully comparable?
Because each country uses its own definition of an urban area; the UN compiles and smooths those figures but does not harmonize them.