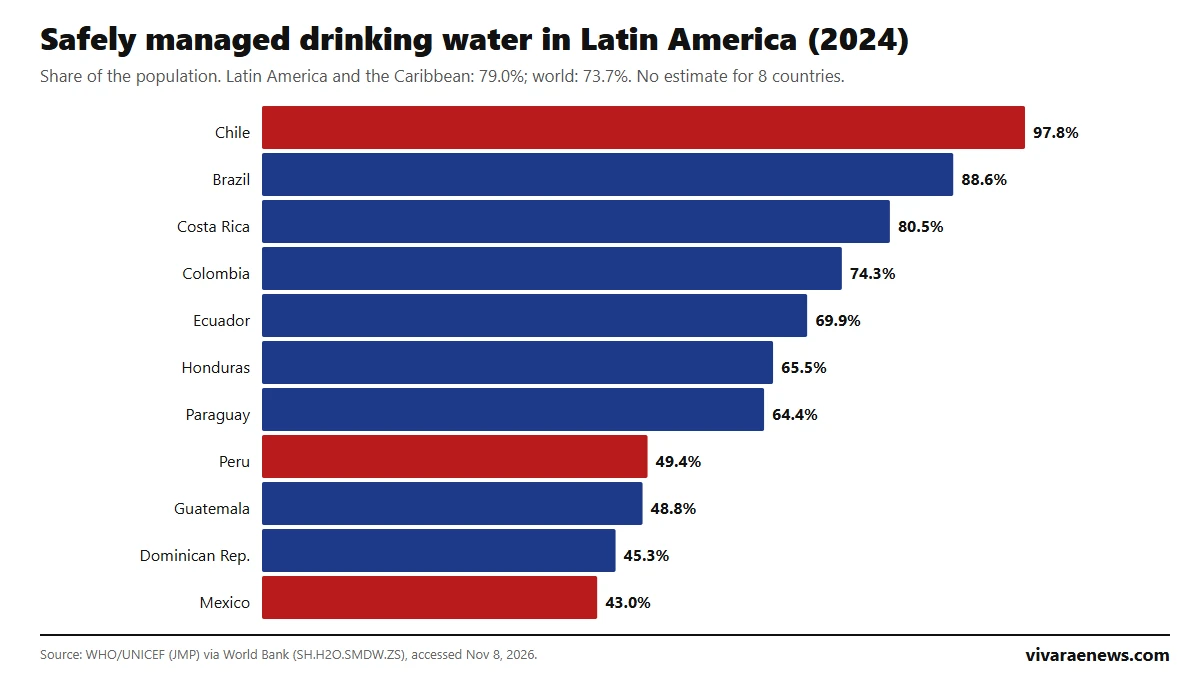
Chile is the Latin American country with the highest access to safely managed drinking water: 97.8% of its population had it in 2024, followed by Brazil (88.6%) and Costa Rica (80.5%), according to the WHO/UNICEF Joint Monitoring Programme (JMP) data published by the WHO/UNICEF (JMP) via the World Bank. At the other end are Mexico (43.0%), the Dominican Republic (45.3%), Guatemala (48.8%) and Peru (49.4%). The Latin America and Caribbean average is 79.0%, above the world's (73.7%).
"Safely managed" is the highest standard in the Sustainable Development Goals: water from an improved source, located on the premises, available when needed and free from contamination. Nearly the whole region has at least basic service, but the step up to safe service leaves out about 74.6 million Mexicans and 17.3 million Peruvians. The JMP only publishes this estimate for 11 countries in the region.
View the data as a table
| Chile, the regional leader | 97.8% |
| Latin America and Caribbean average | 79.0% |
| Mexico, last among countries with data | 43.0% |
| Rural areas in the region | 53.7% |
Ranking of access to drinking water in Latin America (2024)
| Rank | Country | Safely managed water (%) | People without that service (millions) |
|---|---|---|---|
| 1 | Chile | 97.8 | 0.4 |
| 2 | Brazil | 88.6 | 24.1 |
| 3 | Costa Rica | 80.5 | 1.0 |
| 4 | Colombia | 74.3 | 13.6 |
| 5 | Ecuador | 69.9 | 5.5 |
| 6 | Honduras | 65.5 | 3.7 |
| 7 | Paraguay | 64.4 | 2.5 |
| 8 | Peru | 49.4 | 17.3 |
| 9 | Guatemala | 48.8 | 9.4 |
| 10 | Dominican Rep. | 45.3 | 6.2 |
| 11 | Mexico | 43.0 | 74.6 |
Source: WHO/UNICEF (JMP) via the World Bank, indicator SH.H2O.SMDW.ZS, last updated October 8, 2026, accessed November 8, 2026. People without service: Vivarae News calculation using the World Bank's 2024 population. There is no estimate for Argentina, Bolivia, Cuba, El Salvador, Nicaragua, Panama, Uruguay or Venezuela.
View the data as a table
| Chile | 97.8% |
| Brazil | 88.6% |
| Costa Rica | 80.5% |
| Colombia | 74.3% |
| Ecuador | 69.9% |
| Honduras | 65.5% |
| Paraguay | 64.4% |
| Peru | 49.4% |
| Guatemala | 48.8% |
| Dominican Republic | 45.3% |
| Mexico | 43.0% |
Mexico's figure stands out against its income: 99.5% of its population has at least basic water, but only 43.0% meets all three criteria for safe service. The difference is that safe service also requires water on the premises, available when needed and free from contamination.
What each level of drinking water service measures
| Level (JMP ladder) | What it means |
|---|---|
| Safely managed | Improved source on the premises, available when needed and free from contamination |
| Basic | Improved source no more than 30 minutes round trip, including queuing |
| Limited | Improved source more than 30 minutes round trip |
| Unimproved | Unprotected wells or springs |
| Surface water | Rivers, lakes, ditches or canals |
Source: definitions from the WHO/UNICEF Joint Monitoring Programme. Each level includes the one below: anyone with safe water also has basic water. That is why a country can have nearly 100% of people with basic water and less than half with safe water.
Basic drinking water: nearly the whole region has access
Under the basic standard, an improved source within 30 minutes round trip, the picture changes: Brazil (100%), Costa Rica, Uruguay, Paraguay and Mexico exceed 99%, and the regional average is 97.6%. The lowest are El Salvador (91.6%), Ecuador (92.1%) and Guatemala (93.2%). Argentina only has 2016 data (99.0%).
Latin America's rural drinking water gap
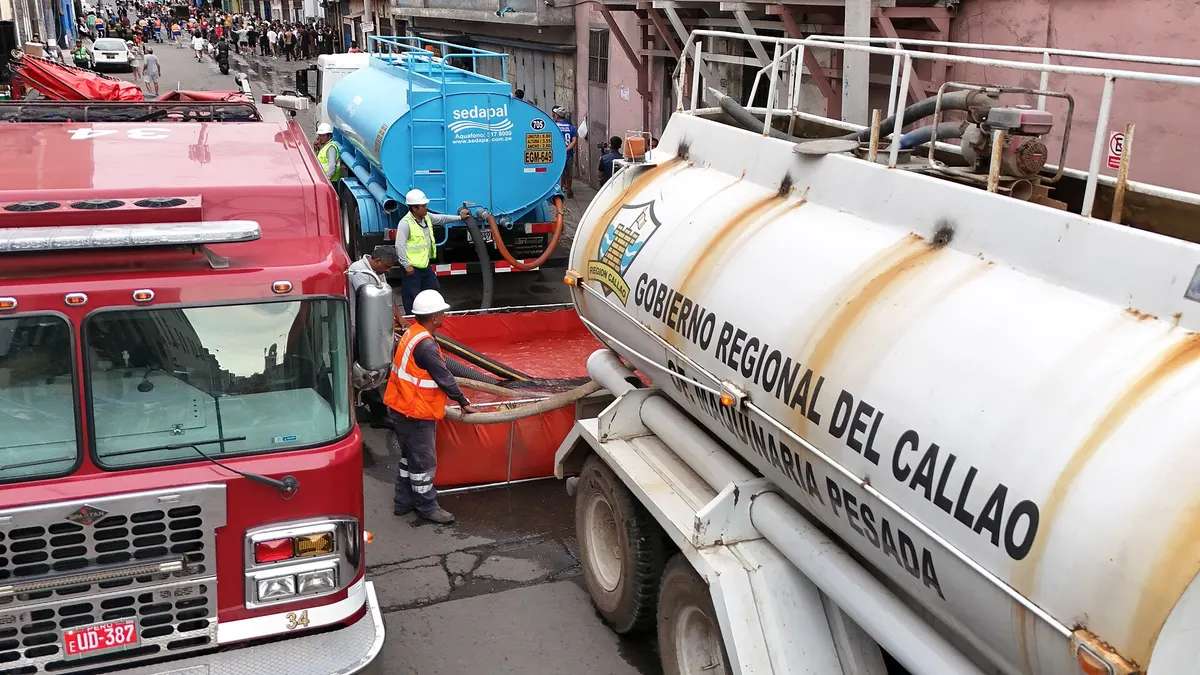
In rural Latin America and the Caribbean, only 53.7% of the population has safely managed water, versus 84.5% in cities. Peru has the widest gap among countries with data: 23.6% in the countryside and 56.2% in cities. Costa Rica is the exception, with higher rural coverage (81.1%) than urban (80.4%).
| Country | Rural (%) | Urban (%) |
|---|---|---|
| Costa Rica | 81.1 | 80.4 |
| Brazil | 73.6 | 90.7 |
| World | 60.4 | 83.4 |
| Latin America and the Caribbean | 53.7 | 84.5 |
| Paraguay | 50.7 | 72.2 |
| Ecuador | 46.7 | 82.4 |
| Honduras | 45.5 | 78.4 |
| Guatemala | 45.4 | 51.7 |
| Colombia | 38.7 | 81.8 |
| Dominican Rep. | 36.2 | 46.9 |
| Peru | 23.6 | 56.2 |
Source: WHO/UNICEF (JMP) via the World Bank, indicators SH.H2O.SMDW.RU.ZS and SH.H2O.SMDW.UR.ZS, 2024.
How access to drinking water has changed since 2000
View the data as a table
| Chile | Brazil | Colombia | Peru | Mexico | Latin America and the Caribbean | |
|---|---|---|---|---|---|---|
| 2000 | 91.5% | 75.8% | 67.7% | 45.0% | 40.0% | 70.2% |
| 2001 | 92.0% | 76.3% | 68.0% | 45.4% | 40.2% | 70.5% |
| 2002 | 92.4% | 76.9% | 68.4% | 45.8% | 40.3% | 70.7% |
| 2003 | 92.8% | 77.4% | 68.7% | 46.2% | 40.4% | 71.0% |
| 2004 | 93.2% | 77.8% | 69.0% | 46.5% | 40.6% | 71.3% |
| 2005 | 93.6% | 78.0% | 69.3% | 46.9% | 40.7% | 71.9% |
| 2006 | 93.9% | 78.3% | 69.6% | 47.3% | 40.9% | 72.1% |
| 2007 | 94.3% | 78.5% | 69.9% | 47.6% | 41.0% | 72.4% |
| 2008 | 94.7% | 78.8% | 70.2% | 48.0% | 41.1% | 72.7% |
| 2009 | 95.1% | 79.0% | 70.5% | 48.2% | 41.3% | 73.0% |
| 2010 | 95.5% | 79.3% | 70.7% | 48.5% | 41.4% | 73.3% |
| 2011 | 95.9% | 79.5% | 71.0% | 48.8% | 41.5% | 73.5% |
| 2012 | 96.2% | 79.7% | 71.3% | 49.1% | 41.7% | 73.8% |
| 2013 | 96.6% | 80.5% | 71.6% | 49.4% | 41.8% | 74.3% |
| 2014 | 96.9% | 81.2% | 71.9% | 49.6% | 41.9% | 74.7% |
| 2015 | 97.0% | 82.0% | 72.1% | 49.9% | 42.0% | 75.2% |
| 2016 | 97.1% | 82.7% | 72.4% | 50.2% | 42.1% | 75.7% |
| 2017 | 97.1% | 83.5% | 72.7% | 50.5% | 42.3% | 76.1% |
| 2018 | 97.2% | 84.3% | 72.9% | 50.8% | 42.4% | 76.6% |
| 2019 | 97.3% | 85.0% | 73.2% | 51.0% | 42.5% | 77.0% |
| 2020 | 97.4% | 85.7% | 73.4% | 51.3% | 42.6% | 77.5% |
| 2021 | 97.5% | 86.4% | 73.7% | 51.6% | 42.7% | 77.9% |
| 2022 | 97.6% | 87.1% | 73.9% | 50.9% | 42.9% | 78.2% |
| 2023 | 97.7% | 88.0% | 74.2% | 50.2% | 42.9% | 78.6% |
| 2024 | 97.8% | 88.6% | 74.3% | 49.4% | 43.0% | 79.0% |
Between 2000 and 2024, the regional average rose from 70.2% to 79.0%. Chile went from 91.5% to 97.8% and Mexico barely moved, from 40.0% to 43.0%. Peru reached 51.6% in 2021, but the current series puts it at 49.4% in 2024. The race shows how the rankings shifted:
View the data as a table
| 2000 | 2001 | 2002 | 2003 | 2004 | 2005 | 2006 | 2007 | 2008 | 2009 | 2010 | 2011 | 2012 | 2013 | 2014 | 2015 | 2016 | 2017 | 2018 | 2019 | 2020 | 2021 | 2022 | 2023 | 2024 | |
|---|---|---|---|---|---|---|---|---|---|---|---|---|---|---|---|---|---|---|---|---|---|---|---|---|---|
| Brazil | 75.8% | 76.3% | 76.9% | 77.4% | 77.8% | 78.0% | 78.3% | 78.5% | 78.8% | 79.0% | 79.3% | 79.5% | 79.7% | 80.5% | 81.2% | 82.0% | 82.7% | 83.5% | 84.3% | 85.0% | 85.7% | 86.4% | 87.1% | 88.0% | 88.6% |
| Chile | 91.5% | 92.0% | 92.4% | 92.8% | 93.2% | 93.6% | 93.9% | 94.3% | 94.7% | 95.1% | 95.5% | 95.9% | 96.2% | 96.6% | 96.9% | 97.0% | 97.1% | 97.1% | 97.2% | 97.3% | 97.4% | 97.5% | 97.6% | 97.7% | 97.8% |
| Colombia | 67.7% | 68.0% | 68.4% | 68.7% | 69.0% | 69.3% | 69.6% | 69.9% | 70.2% | 70.5% | 70.7% | 71.0% | 71.3% | 71.6% | 71.9% | 72.1% | 72.4% | 72.7% | 72.9% | 73.2% | 73.4% | 73.7% | 73.9% | 74.2% | 74.3% |
| Costa Rica | 76.6% | 76.9% | 77.2% | 77.5% | 77.8% | 78.0% | 78.3% | 78.5% | 78.8% | 79.0% | 79.2% | 79.4% | 79.6% | 79.7% | 79.9% | 80.0% | 80.2% | 80.3% | 80.5% | 80.5% | 80.5% | 80.5% | 80.5% | 80.5% | 80.5% |
| Dominican Rep. | 42.1% | 42.2% | 42.3% | 42.5% | 42.7% | 42.9% | 43.1% | 43.3% | 43.5% | 43.7% | 43.8% | 44.0% | 44.1% | 44.3% | 44.4% | 44.5% | 44.6% | 44.7% | 44.8% | 44.9% | 45.0% | 45.1% | 45.2% | 45.3% | 45.3% |
| Ecuador | 61.6% | 62.0% | 62.4% | 62.8% | 63.2% | 63.5% | 63.9% | 64.3% | 64.6% | 65.0% | 65.4% | 65.7% | 66.1% | 66.4% | 66.8% | 67.1% | 67.5% | 67.9% | 68.2% | 68.6% | 68.9% | 69.3% | 69.5% | 69.7% | 69.9% |
| Guatemala | 49.8% | 49.9% | 49.9% | 49.9% | 49.8% | 49.8% | 49.8% | 49.8% | 49.7% | 49.7% | 49.7% | 49.6% | 49.6% | 49.5% | 49.5% | 49.4% | 49.4% | 49.3% | 49.3% | 49.2% | 49.1% | 49.0% | 49.0% | 48.9% | 48.8% |
| Honduras | 41.8% | 42.0% | 42.3% | 43.6% | 45.0% | 46.4% | 47.8% | 49.3% | 50.8% | 52.4% | 53.9% | 55.5% | 57.2% | 58.8% | 60.5% | 61.9% | 62.3% | 62.8% | 63.2% | 63.6% | 64.0% | 64.4% | 64.8% | 65.2% | 65.5% |
| Mexico | 40.0% | 40.2% | 40.3% | 40.4% | 40.6% | 40.7% | 40.9% | 41.0% | 41.1% | 41.3% | 41.4% | 41.5% | 41.7% | 41.8% | 41.9% | 42.0% | 42.1% | 42.3% | 42.4% | 42.5% | 42.6% | 42.7% | 42.9% | 42.9% | 43.0% |
| Peru | 45.0% | 45.4% | 45.8% | 46.2% | 46.5% | 46.9% | 47.3% | 47.6% | 48.0% | 48.2% | 48.5% | 48.8% | 49.1% | 49.4% | 49.6% | 49.9% | 50.2% | 50.5% | 50.8% | 51.0% | 51.3% | 51.6% | 50.9% | 50.2% | 49.4% |
| Paraguay | 49.9% | 50.7% | 51.6% | 52.3% | 53.0% | 53.8% | 54.5% | 55.2% | 55.9% | 56.6% | 57.2% | 57.9% | 58.6% | 59.3% | 59.9% | 60.6% | 61.2% | 61.8% | 62.5% | 63.1% | 63.7% | 64.0% | 64.2% | 64.3% | 64.4% |
| Country | 2000 | 2010 | 2020 | 2024 |
|---|---|---|---|---|
| Chile | 91.5 | 95.5 | 97.4 | 97.8 |
| Brazil | 75.8 | 79.3 | 85.7 | 88.6 |
| Costa Rica | 76.6 | 79.2 | 80.5 | 80.5 |
| Colombia | 67.7 | 70.7 | 73.4 | 74.3 |
| Mexico | 40.0 | 41.4 | 42.6 | 43.0 |
| Peru | 45.0 | 48.5 | 51.3 | 49.4 |
| Latin America and the Caribbean | 70.2 | 73.3 | 77.5 | 79.0 |
Source: WHO/UNICEF (JMP) via the World Bank, SH.H2O.SMDW.ZS. JMP estimates are revised with each new round of data, so the full series may differ from earlier versions.
Drinking water, sanitation and income
View the data as a table
| GDP per capita 2025 (US$) | Safely managed water (%) | |
|---|---|---|
| Chile | 17,995.0 | 97.8% |
| Brazil | 10,713.0 | 88.6% |
| Costa Rica | 19,970.0 | 80.5% |
| Colombia | 8,562.0 | 74.3% |
| Ecuador | 7,125.0 | 69.9% |
| Honduras | 3,598.0 | 65.5% |
| Paraguay | 7,027.0 | 64.4% |
| Peru | 9,684.0 | 49.4% |
| Guatemala | 6,598.0 | 48.8% |
| Dominican Rep. | 11,059.0 | 45.3% |
| Mexico | 13,889.0 | 43.0% |
Higher income tends to go with more safe water, but Mexico is the big exception: with a higher GDP per capita than Colombia, Peru or Ecuador, it has lower coverage than all of them. The table brings together each country's access to safely managed water and sanitation; in sanitation, Chile also leads (95.1%), while Colombia (18.7%) comes last. For other comparisons, see health spending and poverty in Latin America.
| Brazil | 88.6 | 100.0 | 73.6 | 55.0 |
| Costa Rica | 80.5 | 99.8 | 81.1 | 26.3 |
| Uruguay | No data | 99.6 | No data | No data |
| Paraguay | 64.4 | 99.6 | 50.7 | 58.5 |
| Mexico | 43.0 | 99.5 | No data | 62.7 |
| Chile | 97.8 | 99.1 | No data | 95.1 |
| Argentina | No data | 99.0 | No data | No data |
| Dominican Rep. | 45.3 | 97.5 | 36.2 | 43.0 |
| Colombia | 74.3 | 97.1 | 38.7 | 18.7 |
| Honduras | 65.5 | 95.7 | 45.5 | No data |
| Peru | 49.4 | 95.6 | 23.6 | 56.5 |
| Panama | No data | 95.3 | No data | No data |
| Cuba | No data | 95.1 | No data | 45.9 |
| Bolivia | No data | 93.4 | No data | No data |
| Venezuela | No data | 93.3 | No data | 26.0 |
| Guatemala | 48.8 | 93.2 | 45.4 | No data |
| Ecuador | 69.9 | 92.1 | 46.7 | 49.3 |
| El Salvador | No data | 91.6 | No data | 36.0 |
How to cite this data
Vivarae News (2026). "Access to safe drinking water in Latin America: ranking by country 2026". Updated November 8, 2026. Available at https://vivaraenews.com/en/access-to-safe-drinking-water-in-latin-america-ranking-by-country-2026/. The data may be reproduced by citing Vivarae News and linking to this page; each country's figures come from the WHO/UNICEF Joint Monitoring Programme, published by the World Bank.
Frequently asked questions
Which Latin American country has the most access to drinking water?
Chile, with 97.8% of the population with safely managed water in 2024, according to WHO/UNICEF via the World Bank.
What does safely managed water mean?
Water from an improved source, on the premises, available when needed and free from fecal and priority chemical contamination.
Why is Mexico's percentage so low?
Because although 99.5% have at least basic water, only 43.0% meet all the criteria for safe service, especially continuity and quality.
What is the Latin American average?
79.0% in 2024, versus 73.7% worldwide.
Why is Argentina missing?
Because the JMP does not publish a safely managed water estimate for Argentina; its latest basic water figure is from 2016.