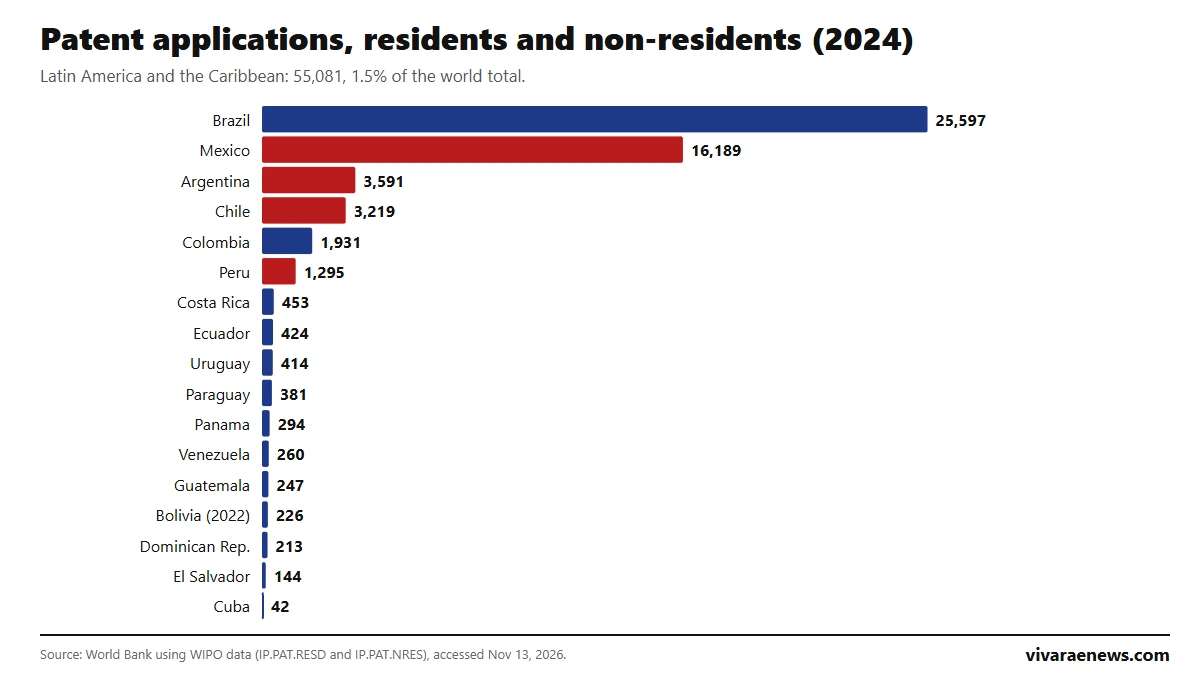
Brazil is the Latin American country that receives the most patent applications: 25,597 in 2024, of which 5,752 were filed by residents, according to the World Bank, using WIPO data. It is followed by Mexico (16,189), Argentina (3,591) and Chile (3,219). Peru, with 1,295, ranks 6 of 17. Across Latin America and the Caribbean, 55,081 applications were filed, just 1.5% of the world's 3.73 million.
A patent protects an invention, a new product or a new process for about 20 years. The indicator counts applications filed with each country's national patent office, split between residents (people or companies from the country itself) and non-residents (foreigners seeking to protect their invention in that market). This ranking of patent applications in Latin America is updated on this same page when the World Bank publishes new data.
View the data as a table
| Brazil | 25,597 |
| Chile | 3,219 |
| Latin America and the Caribbean | 55,081 |
| Non-resident applications in the region | 85% |
Ranking of patent applications in Latin America
| Rank | Country | Total | Residents | Non-residents | Year |
|---|---|---|---|---|---|
| 1 | Brazil | 25,597 | 5,752 | 19,845 | 2024 |
| 2 | Mexico | 16,189 | 1,172 | 15,017 | 2024 |
| 3 | Argentina | 3,591 | 445 | 3,146 | 2024 |
| 4 | Chile | 3,219 | 390 | 2,829 | 2024 |
| 5 | Colombia | 1,931 | 270 | 1,661 | 2024 |
| 6 | Peru | 1,295 | 214 | 1,081 | 2024 |
| 7 | Costa Rica | 453 | 15 | 438 | 2024 |
| 8 | Ecuador | 424 | 53 | 371 | 2024 |
| 9 | Uruguay | 414 | 13 | 401 | 2024 |
| 10 | Paraguay | 381 | 15 | 366 | 2024 |
| 11 | Panama | 294 | 11 | 283 | 2024 |
| 12 | Venezuela | 260 | 63 | 197 | 2024 |
| 13 | Guatemala | 247 | 8 | 239 | 2024 |
| 14 | Bolivia | 226 | 10 | 216 | 2022 |
| 15 | Dominican Rep. | 213 | 11 | 202 | 2024 |
| 16 | El Salvador | 144 | 6 | 138 | 2024 |
| 17 | Cuba | 42 | 12 | 30 | 2024 |
Source: World Bank, using World Intellectual Property Organization (WIPO) data (IP.PAT.RESD and IP.PAT.NRES), accessed November 13, 2026. 2024 data; Bolivia, 2022. No complete recent data for Honduras and Nicaragua. More than eight out of ten applications in the region are filed by foreigners: pharmaceutical, chemical and technology companies protecting their products before selling them in each market. In Mexico, 93% of applications are from non-residents; in Chile, 88%.
View the data as a table
| Brazil | 25,597 · 2024 |
| Mexico | 16,189 · 2024 |
| Argentina | 3,591 · 2024 |
| Chile | 3,219 · 2024 |
| Colombia | 1,931 · 2024 |
| Peru | 1,295 · 2024 |
| Costa Rica | 453 · 2024 |
| Ecuador | 424 · 2024 |
| Uruguay | 414 · 2024 |
| Paraguay | 381 · 2024 |
| Panama | 294 · 2024 |
| Venezuela | 260 · 2024 |
| Guatemala | 247 · 2024 |
| Bolivia | 226 · 2022 |
| Dominican Republic | 213 · 2024 |
| El Salvador | 144 · 2024 |
| Cuba | 42 · 2024 |

Which Latin American countries patent the most per capita
Resident applications per million people are a better measure of how much each country invents. Brazil leads again, with 27.1 per million, followed by Chile (19.7). Argentina has 9.7, Mexico 9.0 and Peru 6.3. For reference, 2,702,600 resident applications were filed worldwide in 2024, most of them in China, the United States, Japan and South Korea:
Source: World Bank, using World Intellectual Property Organization (WIPO) data (IP.PAT.RESD and IP.PAT.NRES), accessed November 13, 2026; the per capita figure uses World Bank population for the same year. Universities and research centers account for a large share of resident patents in the region. For each country's research effort, see the rankings of research and development spending and high-tech exports.

How patent applications have changed since 2005
Applications in Latin America grew little over two decades. Brazil went from 18,498 in 2005 to 25,597 in 2024; Mexico from 14,435 to 16,189; and Chile from 3,007 to 3,219. Argentina fell from 5,269 to 3,591. Peru went from 1,020 to 1,295, and its resident applications went from 67 in 2015 to 214 in 2024, more than tripling.
View the data as a table
| Mexico | Argentina | Chile | Colombia | Peru | |
|---|---|---|---|---|---|
| 2005 | 14,435 | 5,269 | 3,007 | 1,761 | 1,020 |
| 2010 | 14,576 | 4,717 | 1,076 | 1,872 | 300 |
| 2015 | 18,071 | 4,125 | 3,274 | 2,242 | 1,249 |
| 2019 | 15,941 | 3,702 | 3,237 | 2,157 | 1,259 |
| 2020 | 14,312 | 3,492 | 2,805 | 2,121 | 1,267 |
| 2021 | 16,161 | 3,669 | 3,082 | 2,287 | 1,235 |
| 2022 | 16,605 | 3,576 | 3,136 | 3,032 | 1,449 |
| 2023 | 15,630 | 3,418 | 3,251 | 2,012 | 1,340 |
| 2024 | 16,189 | 3,591 | 3,219 | 1,931 | 1,295 |
| Country | 2005 | 2010 | 2015 | 2019 | 2020 | 2021 | 2022 | 2023 | 2024 |
|---|---|---|---|---|---|---|---|---|---|
| Brazil | 18,498 | 24,999 | 30,219 | 25,396 | 24,338 | 24,232 | 24,759 | 25,369 | 25,597 |
| Mexico | 14,435 | 14,576 | 18,071 | 15,941 | 14,312 | 16,161 | 16,605 | 15,630 | 16,189 |
| Argentina | 5,269 | 4,717 | 4,125 | 3,702 | 3,492 | 3,669 | 3,576 | 3,418 | 3,591 |
| Chile | 3,007 | 1,076 | 3,274 | 3,237 | 2,805 | 3,082 | 3,136 | 3,251 | 3,219 |
| Colombia | 1,761 | 1,872 | 2,242 | 2,157 | 2,121 | 2,287 | 3,032 | 2,012 | 1,931 |
| Peru | 1,020 | 300 | 1,249 | 1,259 | 1,267 | 1,235 | 1,449 | 1,340 | 1,295 |
Source: World Bank, using World Intellectual Property Organization (WIPO) data (IP.PAT.RESD and IP.PAT.NRES), accessed November 13, 2026. Brazil is left out of the chart because its scale, above 25,000 applications, would flatten the rest; its figures are in the table.
Patents in Chile, Mexico, Argentina and Peru
Mexico receives five times as many applications as Chile, but almost all are from foreigners: Mexican residents filed 1,172 in 2024, versus 390 from Chilean residents, 445 from Argentines and 214 from Peruvians. With a population more than six times smaller than Mexico's, Chile files a third as many resident applications, which is why it ranks second in the region per capita.
Frequently asked questions
Which Latin American country has the most patent applications?
Brazil, with 25,597 in 2024, according to WIPO and the World Bank.
How many patents are applied for in Chile?
3,219 in 2024: 390 from residents and 2,829 from non-residents.
What is the difference between residents and non-residents?
Resident applications are filed by people or companies from the country; non-resident ones by foreigners seeking to protect their invention in that market.
How often is this ranking updated?
When the World Bank publishes new WIPO data, usually once a year. It is updated at this same URL.
How to cite this data
Vivarae News (2026). "Patent applications in Latin America: ranking by country 2026". Updated November 13, 2026. Available at https://vivaraenews.com/en/patent-applications-in-latin-america-ranking-by-country-2026/. The data may be reproduced by citing Vivarae News and linking to this page; each country's figures come from the World Bank, using WIPO data.