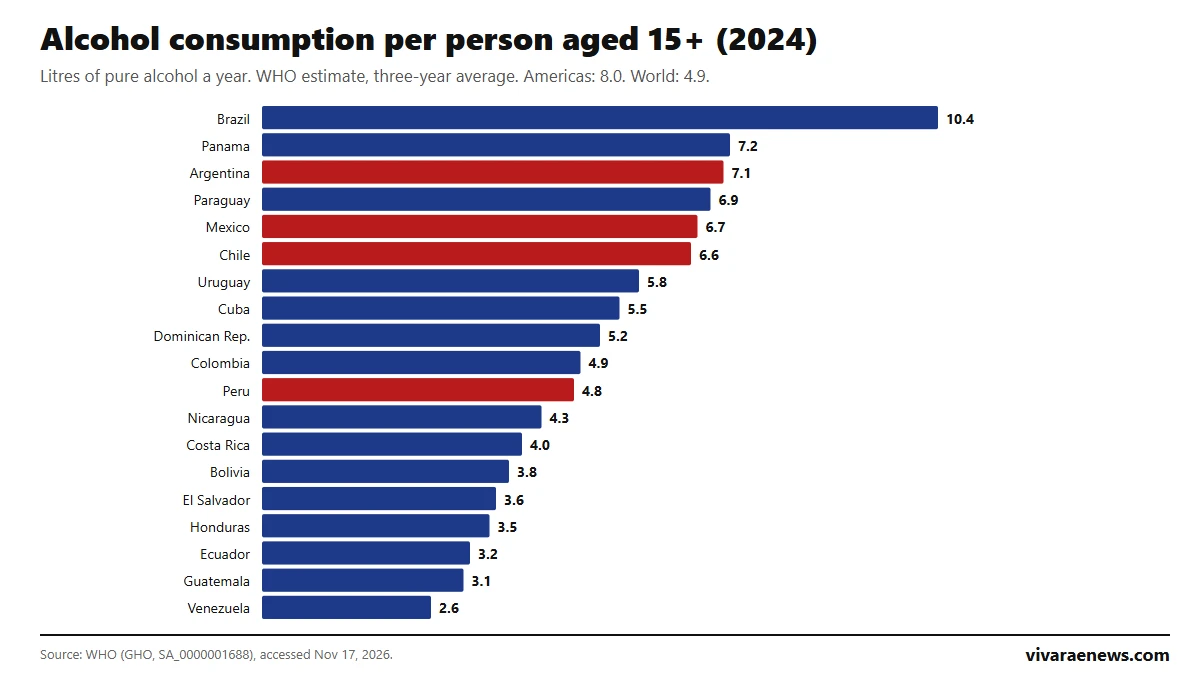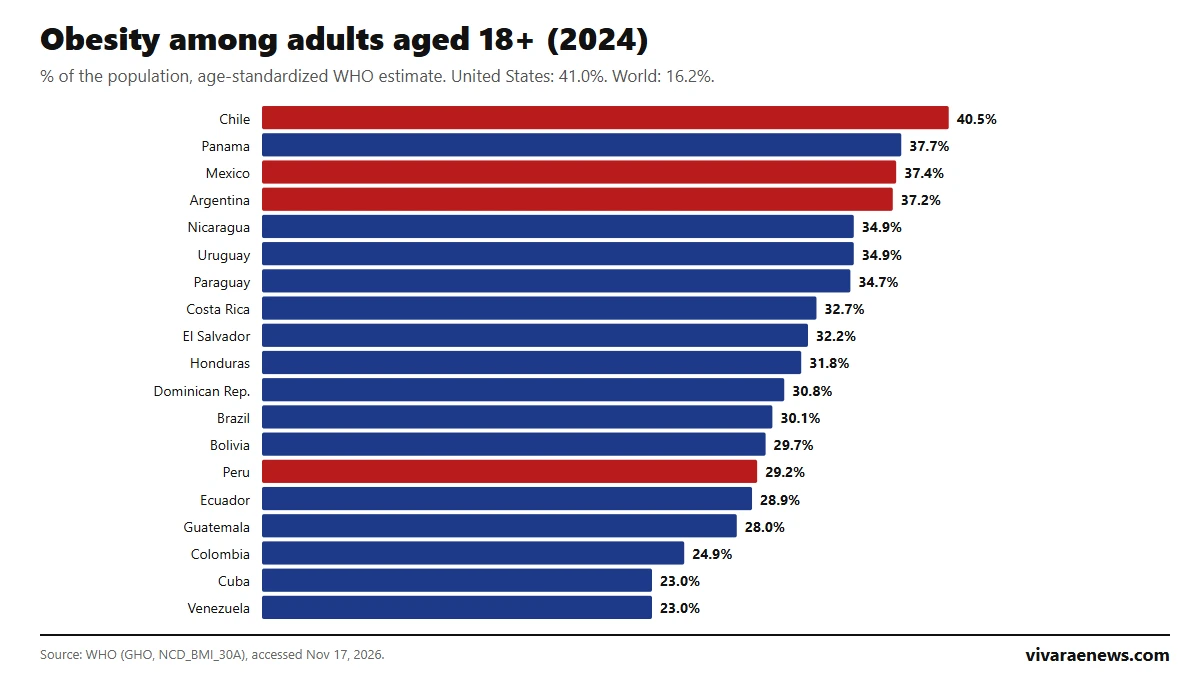
Chile has the highest adult obesity rate in Latin America: 40.5% of people aged 18 and over were living with obesity in 2024, according to estimates from the World Health Organization. That is practically the same figure as the United States (41.0%) and more than double the world average (16.2%). Behind Chile are Panama (37.7%), Mexico (37.4%) and Argentina (37.2%). Peru, at 29.2%, ranks 14 of 19, and Cuba and Venezuela, at 23.0%, close the list. The simple average of the 19 countries is 31.7%.
The WHO considers an adult to have obesity when their body mass index (BMI, weight in kilograms divided by height in meters squared) is 30 or more. The figures in this ranking of obesity in Latin America are age-standardized estimates, which the WHO produces with the NCD-RisC scientific consortium from surveys of measured weight and height, so that countries can be compared even if their populations have different ages. They may therefore differ from each country's national health surveys. The ranking is updated on this same page whenever the WHO publishes new estimates.
View the data as a table
| Chile | 40.5% |
| United States | 41.0% |
| Americas | 34.4% |
| World | 16.2% |
Ranking of obesity in Latin America in 2024
| Rank | Country | Obesity 2024 (%) | 2010 (%) | 2000 (%) | 1990 (%) |
|---|---|---|---|---|---|
| 1 | Chile | 40.5 | 27.9 | 20.6 | 13.4 |
| 2 | Panama | 37.7 | 25.0 | 17.3 | 11.1 |
| 3 | Mexico | 37.4 | 28.0 | 21.5 | 14.5 |
| 4 | Argentina | 37.2 | 24.7 | 18.3 | 12.7 |
| 5 | Nicaragua | 34.9 | 26.3 | 19.6 | 12.9 |
| 6 | Uruguay | 34.9 | 23.5 | 17.4 | 12.2 |
| 7 | Paraguay | 34.7 | 23.5 | 17.3 | 12.0 |
| 8 | Costa Rica | 32.7 | 23.7 | 17.3 | 11.2 |
| 9 | El Salvador | 32.2 | 24.1 | 17.8 | 11.8 |
| 10 | Honduras | 31.8 | 21.4 | 14.3 | 8.6 |
| 11 | Dominican Rep. | 30.8 | 21.1 | 14.3 | 8.4 |
| 12 | Brazil | 30.1 | 17.6 | 12.3 | 8.7 |
| 13 | Bolivia | 29.7 | 19.5 | 13.3 | 8.7 |
| 14 | Peru | 29.2 | 17.1 | 12.0 | 8.7 |
| 15 | Ecuador | 28.9 | 19.1 | 13.7 | 9.7 |
| 16 | Guatemala | 28.0 | 18.0 | 11.7 | 6.9 |
| 17 | Colombia | 24.9 | 17.0 | 11.7 | 7.5 |
| 18 | Cuba | 23.0 | 15.3 | 10.6 | 7.2 |
| 19 | Venezuela | 23.0 | 22.3 | 18.7 | 12.7 |
Source: World Health Organization (WHO), indicator "prevalence of obesity among adults, BMI ≥ 30 (age-standardized estimate)", population aged 18 and over, 2024 data, accessed November 17, 2026. For reference, the WHO estimates 34.4% for the Americas as a whole, 41.0% for the United States, 15.3% for Spain and 16.2% for the world. The estimates have a margin of uncertainty, so countries with very similar figures, such as Nicaragua and Uruguay, should be read as tied.
View the data as a table
| Chile | 40.5% |
| Panama | 37.7% |
| Mexico | 37.4% |
| Argentina | 37.2% |
| Nicaragua | 34.9% |
| Uruguay | 34.9% |
| Paraguay | 34.7% |
| Costa Rica | 32.7% |
| El Salvador | 32.2% |
| Honduras | 31.8% |
| Dominican Republic | 30.8% |
| Brazil | 30.1% |
| Bolivia | 29.7% |
| Peru | 29.2% |
| Ecuador | 28.9% |
| Guatemala | 28.0% |
| Colombia | 24.9% |
| Cuba | 23.0% |
| Venezuela | 23.0% |

Obesity among men and women in Latin America
In 19 of the 19 countries obesity is more common among women than men. The highest female rate is in Chile, 46.4%, followed by Panama (45.0%) and Mexico (41.4%). Among men, Argentina ranks first at 35.9%, with Chile second at 34.4%. Argentina has the smallest gap between the sexes: 35.9% for men and 38.4% for women. In the table below you can search for a country and sort by any column:
| Chile | 40.5% | 34.4% | 46.4% |
| Panama | 37.7% | 30.3% | 45.0% |
| Mexico | 37.4% | 32.7% | 41.4% |
| Argentina | 37.2% | 35.9% | 38.4% |
| Nicaragua | 34.9% | 28.7% | 40.3% |
| Uruguay | 34.9% | 31.8% | 37.7% |
| Paraguay | 34.7% | 29.3% | 39.8% |
| Costa Rica | 32.7% | 25.6% | 39.4% |
| El Salvador | 32.2% | 23.8% | 38.8% |
| Honduras | 31.8% | 23.9% | 39.3% |
| Dominican Rep. | 30.8% | 24.2% | 37.2% |
| Brazil | 30.1% | 26.1% | 33.9% |
| Bolivia | 29.7% | 23.4% | 35.9% |
| Peru | 29.2% | 24.9% | 33.3% |
| Ecuador | 28.9% | 23.7% | 33.9% |
| Guatemala | 28.0% | 23.3% | 32.2% |
| Colombia | 24.9% | 18.7% | 30.7% |
| Cuba | 23.0% | 19.7% | 26.2% |
| Venezuela | 23.0% | 20.2% | 25.4% |
View the data as a table
| Men (%) | Women (%) | |
|---|---|---|
| Chile | 34% | 46% |
| Panama | 30% | 45% |
| Mexico | 33% | 41% |
| Argentina | 36% | 38% |
| Nicaragua | 29% | 40% |
| Uruguay | 32% | 38% |
| Paraguay | 29% | 40% |
| Costa Rica | 26% | 39% |
| El Salvador | 24% | 39% |
| Honduras | 24% | 39% |
| Dominican Rep. | 24% | 37% |
| Brazil | 26% | 34% |
| Bolivia | 23% | 36% |
| Peru | 25% | 33% |
| Ecuador | 24% | 34% |
| Guatemala | 23% | 32% |
| Colombia | 19% | 31% |
| Cuba | 20% | 26% |
| Venezuela | 20% | 25% |
How obesity in Latin America has grown since 1990
Adult obesity has multiplied across the region. In Chile it rose from 13.4% in 1990 to 20.6% in 2000 and 40.5% in 2024, meaning it tripled. Mexico rose from 14.5% to 37.4%, Argentina from 12.7% to 37.2% and Peru from 8.7% to 29.2%. Venezuela is the recent exception: it reached 22.3% in 2010 and fell to 23.0% in 2024. Worldwide, the rate rose from 6.7% to 16.2% over the same period.
View the data as a table
| Chile | Mexico | Argentina | Brazil | Peru | World | |
|---|---|---|---|---|---|---|
| 1990 | 13.4% | 14.5% | 12.7% | 8.7% | 8.7% | 6.7% |
| 1995 | 16.8% | 18.0% | 15.3% | 10.3% | 10.2% | 7.6% |
| 2000 | 20.6% | 21.5% | 18.3% | 12.3% | 12.0% | 8.7% |
| 2005 | 24.2% | 24.8% | 21.3% | 14.6% | 14.2% | 10.1% |
| 2010 | 27.9% | 28.0% | 24.7% | 17.6% | 17.1% | 11.5% |
| 2015 | 32.2% | 31.5% | 28.8% | 21.7% | 21.0% | 13.0% |
| 2020 | 36.8% | 34.8% | 33.4% | 26.2% | 25.5% | 14.6% |
| 2024 | 40.5% | 37.4% | 37.2% | 30.1% | 29.2% | 16.2% |
View the data as a table
| 1990 | 1995 | 2000 | 2005 | 2010 | 2015 | 2020 | 2024 | |
|---|---|---|---|---|---|---|---|---|
| Chile | 13.4% | 16.8% | 20.6% | 24.2% | 27.9% | 32.2% | 36.8% | 40.5% |
| Panama | 11.1% | 13.9% | 17.3% | 20.9% | 25.0% | 29.5% | 34.1% | 37.7% |
| Mexico | 14.5% | 18.0% | 21.5% | 24.8% | 28.0% | 31.5% | 34.8% | 37.4% |
| Argentina | 12.7% | 15.3% | 18.3% | 21.3% | 24.7% | 28.8% | 33.4% | 37.2% |
| Nicaragua | 12.9% | 16.1% | 19.6% | 23.0% | 26.3% | 29.5% | 32.5% | 34.9% |
| Uruguay | 12.2% | 14.6% | 17.4% | 20.3% | 23.5% | 27.4% | 31.5% | 34.9% |
| Paraguay | 12.0% | 14.4% | 17.3% | 20.3% | 23.5% | 27.3% | 31.3% | 34.7% |
| Costa Rica | 11.2% | 14.1% | 17.3% | 20.5% | 23.7% | 27.0% | 30.1% | 32.7% |
| El Salvador | 11.8% | 14.7% | 17.8% | 21.0% | 24.1% | 27.1% | 29.9% | 32.2% |
| Honduras | 8.6% | 11.1% | 14.3% | 17.7% | 21.4% | 25.1% | 28.8% | 31.8% |
| Dominican Rep. | 8.4% | 11.0% | 14.3% | 17.7% | 21.1% | 24.4% | 27.9% | 30.8% |
| Brazil | 8.7% | 10.3% | 12.3% | 14.6% | 17.6% | 21.7% | 26.2% | 30.1% |
| Bolivia | 8.7% | 10.8% | 13.3% | 16.2% | 19.5% | 23.1% | 26.8% | 29.7% |
| Peru | 8.7% | 10.2% | 12.0% | 14.2% | 17.1% | 21.0% | 25.5% | 29.2% |
| Ecuador | 9.7% | 11.5% | 13.7% | 16.2% | 19.1% | 22.5% | 26.0% | 28.9% |
| Guatemala | 6.9% | 9.0% | 11.7% | 14.8% | 18.0% | 21.6% | 25.1% | 28.0% |
| Colombia | 7.5% | 9.4% | 11.7% | 14.2% | 17.0% | 20.0% | 22.7% | 24.9% |
| Cuba | 7.2% | 8.7% | 10.6% | 12.9% | 15.3% | 17.9% | 20.6% | 23.0% |
| Venezuela | 12.7% | 15.7% | 18.7% | 20.9% | 22.3% | 23.0% | 23.0% | 23.0% |
Why obesity in Chile is the highest in the region
The WHO explains in its fact sheet on obesity that the root cause is an imbalance between calories consumed and calories spent, driven by diets with more ultra-processed foods high in sugar and fat and by more sedentary lifestyles. Obesity is a risk factor for type 2 diabetes, cardiovascular disease and several cancers, and it weighs on health spending: see health spending in Latin America and life expectancy by country.
Chile was also one of the first countries to regulate food advertising and labeling: Law 20,606, in force since 2016, requires black "HIGH IN" calories, sugars, sodium or saturated fat warning seals, and Mexico, Peru, Argentina and other countries adopted similar warnings. Even so, WHO estimates show that adult obesity in Chile kept rising: from 32.2% in 2015 to 40.5% in 2024.
| Country | 1990 | 2000 | 2010 | 2024 | Increase 1990-2024 (points) |
|---|---|---|---|---|---|
| Chile | 13.4 | 20.6 | 27.9 | 40.5 | +27.1 |
| Panama | 11.1 | 17.3 | 25.0 | 37.7 | +26.6 |
| Mexico | 14.5 | 21.5 | 28.0 | 37.4 | +22.9 |
| Argentina | 12.7 | 18.3 | 24.7 | 37.2 | +24.5 |
| Brazil | 8.7 | 12.3 | 17.6 | 30.1 | +21.4 |
| Peru | 8.7 | 12.0 | 17.1 | 29.2 | +20.5 |
| Colombia | 7.5 | 11.7 | 17.0 | 24.9 | +17.4 |
| Venezuela | 12.7 | 18.7 | 22.3 | 23.0 | +10.3 |
Source: World Health Organization (WHO), indicator "prevalence of obesity among adults, BMI ≥ 30 (age-standardized estimate)", population aged 18 and over, 2024 data, accessed November 17, 2026; difference calculated by Vivarae News.
Frequently asked questions
Which Latin American country has the most obesity?
Chile, with 40.5% of adults in 2024, according to the WHO. It is followed by Panama (37.7%) and Mexico (37.4%).
Which country has the least obesity in the region?
Cuba and Venezuela, both at 23.0%, followed by Colombia (24.9%).
Does Chile have more obesity than the United States?
No, but it is very close: 40.5% versus 41.0% in 2024, according to the WHO's standardized estimates.
What exactly does this ranking measure?
The percentage of people aged 18 and over with a body mass index of 30 or more, age-standardized to compare countries.
How to cite this data
Vivarae News (2026). "Obesity in Latin America: ranking by country 2026". Updated November 17, 2026. Available at https://vivaraenews.com/en/obesity-in-latin-america-ranking-by-country-2026/. The data may be reproduced by citing Vivarae News and linking to this page; each country's figures come from the World Health Organization.