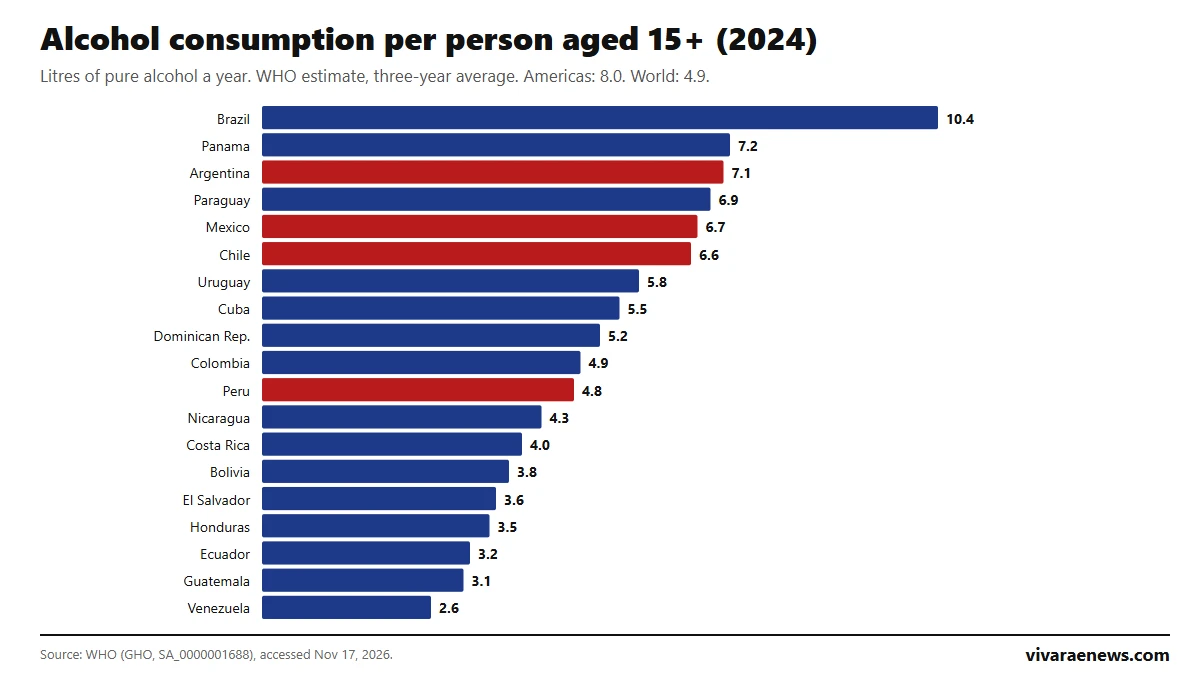
Brazil is the Latin American country that consumes the most alcohol: 10.4 litres of pure alcohol per person aged 15 and over a year, according to 2024 estimates from the World Health Organization. It is followed by Panama (7.2 litres), Argentina (7.1), Paraguay (6.9) and Mexico (6.7). Chile ranks sixth at 6.6 litres and Peru 11th at 4.8. Venezuela has the region's lowest consumption, 2.6 litres. The simple average of the 19 countries is 5.2 litres, above the world average (4.9) and below the Americas average (8.0), which includes the United States and Canada.
The figure measures the pure alcohol (ethanol) contained in everything people drink in a year, both what is recorded in sales and tax data and unrecorded consumption (home production, smuggling or tourists), divided by the population aged 15 and over. The WHO publishes it as a three-year average and uses it to track target 3.5.2 of the Sustainable Development Goals. This ranking of alcohol consumption in Latin America is updated on this same page whenever the WHO publishes new estimates.
View the data as a table
| Brazil | 10.4 L |
| Chile | 6.6 L |
| Americas | 8.0 L |
| World | 4.9 L |
Ranking of alcohol consumption in Latin America in 2024
| Rank | Country | Litres 2024 | 2019 | 2010 | 2000 | Equivalent in 5% beer (litres) |
|---|---|---|---|---|---|---|
| 1 | Brazil | 10.4 | 9.7 | 10.6 | 7.2 | 208 |
| 2 | Panama | 7.2 | 6.7 | 6.8 | 5.7 | 144 |
| 3 | Argentina | 7.1 | 6.6 | 6.6 | 5.6 | 142 |
| 4 | Paraguay | 6.9 | 6.4 | 7.1 | 6.3 | 138 |
| 5 | Mexico | 6.7 | 6.0 | 5.5 | 5.1 | 134 |
| 6 | Chile | 6.6 | 6.9 | 7.2 | 7.0 | 132 |
| 7 | Uruguay | 5.8 | 6.4 | 7.0 | 7.6 | 116 |
| 8 | Cuba | 5.5 | 6.0 | 5.6 | 5.5 | 110 |
| 9 | Dominican Rep. | 5.2 | 4.8 | 5.4 | 6.2 | 104 |
| 10 | Colombia | 4.9 | 3.9 | 4.5 | 5.5 | 98 |
| 11 | Peru | 4.8 | 4.8 | 4.8 | 3.1 | 96 |
| 12 | Nicaragua | 4.3 | 4.2 | 4.0 | 4.2 | 86 |
| 13 | Costa Rica | 4.0 | 3.6 | 3.9 | 4.1 | 80 |
| 14 | Bolivia | 3.8 | 3.8 | 4.4 | 3.0 | 76 |
| 15 | El Salvador | 3.6 | 3.5 | 2.9 | 3.3 | 72 |
| 16 | Honduras | 3.5 | 3.4 | 3.3 | 3.2 | 70 |
| 17 | Ecuador | 3.2 | 3.2 | 4.4 | 4.3 | 64 |
| 18 | Guatemala | 3.1 | 1.9 | 2.1 | 2.4 | 62 |
| 19 | Venezuela | 2.6 | 2.6 | 7.9 | 8.3 | 52 |
Source: World Health Organization (WHO), indicator "total alcohol per capita (15+) consumption, in litres of pure alcohol" (recorded and unrecorded, three-year average), 2024 data, accessed November 17, 2026. The last column is Vivarae News's own calculation: litres of pure alcohol divided by 0.05, the strength of a regular beer. For reference, the WHO estimates 9.6 litres for the United States, 9.2 for Canada, 12.1 for Spain and 8.9 for the European average, the region that drinks the most.
View the data as a table
| Brazil | 10.4 L |
| Panama | 7.2 L |
| Argentina | 7.1 L |
| Paraguay | 6.9 L |
| Mexico | 6.7 L |
| Chile | 6.6 L |
| Uruguay | 5.8 L |
| Cuba | 5.5 L |
| Dominican Republic | 5.2 L |
| Colombia | 4.9 L |
| Peru | 4.8 L |
| Nicaragua | 4.3 L |
| Costa Rica | 4.0 L |
| Bolivia | 3.8 L |
| El Salvador | 3.6 L |
| Honduras | 3.5 L |
| Ecuador | 3.2 L |
| Guatemala | 3.1 L |
| Venezuela | 2.6 L |
How much alcohol a person drinks in Chile, Mexico, Argentina and Peru
To put it in perspective, 6.6 litres of pure alcohol a year, Chile's figure, equals about 132 litres of 5% beer or about 68 bottles of 13% wine per person aged 15 and over (our own calculation). In Mexico, at 6.7 litres, that would be 134 litres of beer; in Argentina, at 7.1, 142 litres; and in Peru, at 4.8, 96 litres. In Brazil, the leader, it reaches 208 litres of beer. These are averages: they include non-drinkers, so consumption among those who do drink is higher.
| Brazil | 10.4 | 208 | 107 |
| Panama | 7.2 | 144 | 74 |
| Argentina | 7.1 | 142 | 73 |
| Paraguay | 6.9 | 138 | 71 |
| Mexico | 6.7 | 134 | 69 |
| Chile | 6.6 | 132 | 68 |
| Uruguay | 5.8 | 116 | 59 |
| Cuba | 5.5 | 110 | 56 |
| Dominican Rep. | 5.2 | 104 | 53 |
| Colombia | 4.9 | 98 | 50 |
| Peru | 4.8 | 96 | 49 |
| Nicaragua | 4.3 | 86 | 44 |
| Costa Rica | 4.0 | 80 | 41 |
| Bolivia | 3.8 | 76 | 39 |
| El Salvador | 3.6 | 72 | 37 |
| Honduras | 3.5 | 70 | 36 |
| Ecuador | 3.2 | 64 | 33 |
| Guatemala | 3.1 | 62 | 32 |
| Venezuela | 2.6 | 52 | 27 |
How alcohol consumption in Latin America has changed since 2000
Unlike obesity, alcohol consumption has no single trend. Brazil rose from 7.2 litres in 2000 to 10.4 in 2024, Mexico from 5.1 to 6.7 and Peru from 3.1 to 4.8. Chile stayed around 7 litres for two decades and fell to 6.6 in 2024, and Uruguay went from 7.6 to 5.8. The biggest drop is Venezuela's, which had 8.3 litres in 2000, the highest level in the region that year, and has stayed around 2.6 since 2019.
View the data as a table
| Brazil | Chile | Mexico | Argentina | Peru | Venezuela | World | |
|---|---|---|---|---|---|---|---|
| 2000 | 7.2 | 7.0 | 5.1 | 5.6 | 3.1 | 8.3 | 4.7 |
| 2005 | 9.8 | 6.6 | 5.3 | 5.3 | 3.7 | 8.5 | 4.8 |
| 2010 | 10.6 | 7.2 | 5.5 | 6.6 | 4.8 | 7.9 | 5.6 |
| 2015 | 9.6 | 7.2 | 5.4 | 7.3 | 5.1 | 6.2 | 5.8 |
| 2019 | 9.7 | 6.9 | 6.0 | 6.6 | 4.8 | 2.6 | 5.1 |
| 2020 | 9.7 | 7.1 | 6.0 | 6.9 | 4.7 | 2.4 | 5.0 |
| 2021 | 9.7 | 7.1 | 6.2 | 7.4 | 4.6 | 2.4 | 4.9 |
| 2022 | 10.1 | 7.0 | 6.5 | 7.6 | 4.8 | 2.6 | 4.9 |
| 2023 | 10.4 | 6.6 | 6.7 | 7.1 | 4.8 | 2.6 | 4.9 |
| 2024 | 10.4 | 6.6 | 6.7 | 7.1 | 4.8 | 2.6 | 4.9 |
View the data as a table
| 2000 | 2005 | 2010 | 2015 | 2019 | 2020 | 2021 | 2022 | 2023 | 2024 | |
|---|---|---|---|---|---|---|---|---|---|---|
| Brazil | 7.2 | 9.8 | 10.6 | 9.6 | 9.7 | 9.7 | 9.7 | 10.1 | 10.4 | 10.4 |
| Panama | 5.7 | 5.7 | 6.8 | 7.0 | 6.7 | 6.6 | 6.5 | 7.0 | 7.2 | 7.2 |
| Argentina | 5.6 | 5.3 | 6.6 | 7.3 | 6.6 | 6.9 | 7.4 | 7.6 | 7.1 | 7.1 |
| Paraguay | 6.3 | 6.4 | 7.1 | 6.5 | 6.4 | 6.5 | 6.6 | 6.8 | 6.9 | 6.9 |
| Mexico | 5.1 | 5.3 | 5.5 | 5.4 | 6.0 | 6.0 | 6.2 | 6.5 | 6.7 | 6.7 |
| Chile | 7.0 | 6.6 | 7.2 | 7.2 | 6.9 | 7.1 | 7.1 | 7.0 | 6.6 | 6.6 |
| Uruguay | 7.6 | 7.0 | 7.0 | 6.8 | 6.4 | 6.4 | 6.4 | 6.1 | 5.8 | 5.8 |
| Cuba | 5.5 | 5.9 | 5.6 | 6.0 | 6.0 | 5.7 | 5.5 | 5.5 | 5.5 | 5.5 |
| Dominican Rep. | 6.2 | 5.5 | 5.4 | 4.7 | 4.8 | 5.0 | 5.1 | 5.2 | 5.2 | 5.2 |
| Colombia | 5.5 | 4.7 | 4.5 | 4.3 | 3.9 | 4.0 | 4.3 | 4.8 | 4.9 | 4.9 |
| Peru | 3.1 | 3.7 | 4.8 | 5.1 | 4.8 | 4.7 | 4.6 | 4.8 | 4.8 | 4.8 |
| Nicaragua | 4.2 | 4.4 | 4.0 | 4.4 | 4.2 | 4.1 | 4.1 | 4.2 | 4.3 | 4.3 |
| Costa Rica | 4.1 | 4.1 | 3.9 | 3.7 | 3.6 | 3.7 | 3.9 | 3.9 | 4.0 | 4.0 |
| Bolivia | 3.0 | 3.6 | 4.4 | 4.2 | 3.8 | 3.8 | 3.7 | 3.8 | 3.8 | 3.8 |
| El Salvador | 3.3 | 3.2 | 2.9 | 3.1 | 3.5 | 3.5 | 3.5 | 3.6 | 3.6 | 3.6 |
| Honduras | 3.2 | 3.6 | 3.3 | 3.0 | 3.4 | 3.5 | 3.5 | 3.5 | 3.5 | 3.5 |
| Ecuador | 4.3 | 4.2 | 4.4 | 4.1 | 3.2 | 3.0 | 2.9 | 3.1 | 3.2 | 3.2 |
| Guatemala | 2.4 | 2.3 | 2.1 | 1.7 | 1.9 | 2.2 | 2.5 | 2.9 | 3.1 | 3.1 |
| Venezuela | 8.3 | 8.5 | 7.9 | 6.2 | 2.6 | 2.4 | 2.4 | 2.6 | 2.6 | 2.6 |
Alcohol consumption and health: what the WHO says
The WHO notes in its fact sheet on alcohol that drinking is linked to more than 200 diseases and injuries, including cirrhosis, several cancers and road traffic crashes, and that there is no completely safe level of consumption for health. In the region, alcohol is one of the factors behind road traffic deaths. For each country's health context, see obesity in Latin America and life expectancy by country.
Frequently asked questions
Which Latin American country drinks the most alcohol?
Brazil, with 10.4 litres of pure alcohol per person aged 15 and over in 2024, according to the WHO. It is followed by Panama (7.2) and Argentina (7.1).
How much alcohol is consumed in Chile?
6.6 litres of pure alcohol per person aged 15 and over a year, the sixth highest of the region's 19 countries, equivalent to about 132 litres of beer (our own calculation).
Which country in the region drinks the least?
Venezuela, at 2.6 litres, followed by Guatemala (3.1) and Ecuador (3.2).
Why is it measured in litres of pure alcohol?
Because it allows drinks of different strengths, such as beer, wine and spirits, to be added up and compared.
How to cite this data
Vivarae News (2026). "Alcohol consumption in Latin America: ranking by country 2026". Updated November 17, 2026. Available at https://vivaraenews.com/en/alcohol-consumption-in-latin-america-ranking-by-country-2026/. The data may be reproduced by citing Vivarae News and linking to this page; each country's figures come from the World Health Organization.