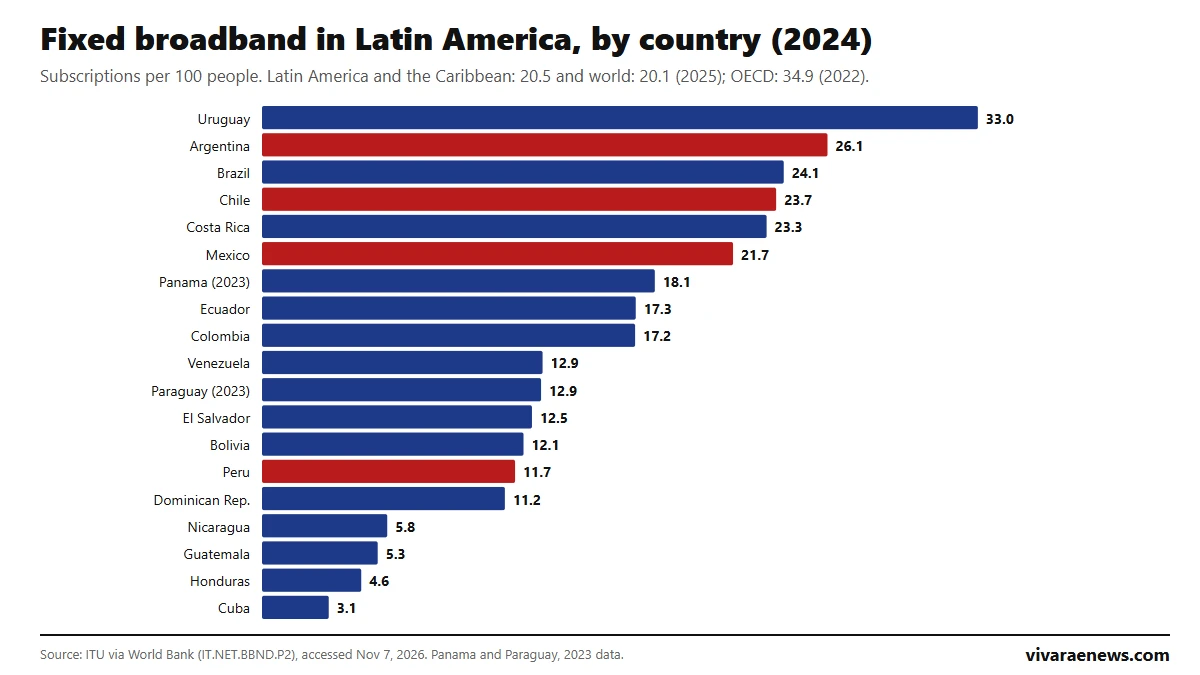
Uruguay is the Latin American country with the most fixed broadband: it had 33.0 subscriptions per 100 people in 2024, followed by Argentina (26.1), Brazil (24.1) and Chile (23.7), according to International Telecommunication Union (ITU) data published by the ITU via the World Bank. The Latin America and Caribbean average reached 20.5 in 2025, just above the world average (20.1) and far from the 34.9 of OECD countries in 2022.
The indicator counts fixed subscriptions to high-speed internet, of at least 256 kbit/s, via cable, fiber, DSL, satellite or fixed wireless. Since one connection usually serves a whole household, 33 subscriptions per 100 people can amount to high household coverage. This ranking covers 19 countries with data and complements our ranking of internet use in Latin America.
View the data as a table
| Uruguay, the regional leader | 33.0 |
| Chile, 4th place | 23.7 |
| Latin America and Caribbean average | 20.5 |
| Fixed connections in the region | 137 million |
Fixed broadband ranking in Latin America (2024)
| Rank | Country | Subscriptions per 100 people | Total subscriptions |
|---|---|---|---|
| 1 | Uruguay | 33.0 | 1,119,065 |
| 2 | Argentina | 26.1 | 11,925,620 |
| 3 | Brazil | 24.1 | 51,047,559 |
| 4 | Chile | 23.7 | 4,690,458 |
| 5 | Costa Rica | 23.3 | 1,194,638 |
| 6 | Mexico | 21.7 | 28,444,894 |
| 7 | Panama | 18.1 (2023) | 808,557 |
| 8 | Ecuador | 17.3 | 3,127,716 |
| 9 | Colombia | 17.2 | 9,109,367 |
| 10 | Venezuela | 12.9 | 3,677,002 |
| 11 | Paraguay | 12.9 (2023) | 881,769 |
| 12 | El Salvador | 12.5 | 789,997 |
| 13 | Bolivia | 12.1 | 1,498,429 |
| 14 | Peru | 11.7 | 3,996,257 |
| 15 | Dominican Republic | 11.2 | 1,280,408 |
| 16 | Nicaragua | 5.8 | 399,493 |
| 17 | Guatemala | 5.3 | 982,517 |
| 18 | Honduras | 4.6 | 495,725 |
| 19 | Cuba | 3.1 | 338,504 |
Source: ITU via the World Bank, indicators IT.NET.BBND.P2 and IT.NET.BBND, last updated October 8, 2026, accessed November 7, 2026. Data for 2024, except Panama and Paraguay (2023). No recent data for Haiti.
View the data as a table
| Uruguay | 33.0 |
| Argentina | 26.1 |
| Brazil | 24.1 |
| Chile | 23.7 |
| Costa Rica | 23.3 |
| Mexico | 21.7 |
| Panama | 18.1 · (2023 data) |
| Ecuador | 17.3 |
| Colombia | 17.2 |
| Venezuela | 13.0 |
| Paraguay | 12.9 · (2023 data) |
| El Salvador | 12.5 |
| Bolivia | 12.1 |
| Peru | 11.7 |
| Dominican Republic | 11.2 |
| Nicaragua | 5.8 |
| Guatemala | 5.3 |
| Honduras | 4.6 |
| Cuba | 3.1 |
The map shows a clear divide: Uruguay, Argentina, Brazil, Chile, Costa Rica and Mexico are above the regional average, while much of Central America and the Caribbean lags far behind. Nicaragua (5.8), Guatemala (5.3), Honduras (4.6) and Cuba (3.1) have fewer than 6 subscriptions per 100 people.
For the four countries with their own Vivarae edition, the picture differs. Argentina is second, with 11.9 million fixed connections. Chile, with 4.69 million, is fourth and above the regional average. Mexico, with 28.4 million connections, is sixth at 21.7 per 100 people. Peru, with 4.0 million, ranks 14th at 11.7, behind Bolivia and El Salvador.
How fixed broadband has grown in Latin America since 2010
View the data as a table
| Chile | Argentina | Mexico | Peru | Uruguay | Brazil | Latin America and the Caribbean | |
|---|---|---|---|---|---|---|---|
| 2010 | 10.4 | 9.8 | 9.3 | 3.2 | 11.6 | 7.3 | 6.8 |
| 2011 | 11.6 | 11.0 | 10.0 | 4.1 | 14.2 | 9.1 | 8.1 |
| 2012 | 12.4 | 12.2 | 11.2 | 4.9 | 17.4 | 9.7 | 8.6 |
| 2013 | 13.0 | 14.7 | 10.8 | 5.4 | 22.0 | 10.8 | 9.3 |
| 2014 | 13.9 | 15.2 | 10.9 | 5.9 | 25.0 | 12.0 | 10.0 |
| 2015 | 15.1 | 15.8 | 12.2 | 6.6 | 26.8 | 12.6 | 10.8 |
| 2016 | 15.9 | 16.5 | 13.0 | 6.9 | 27.3 | 13.2 | 11.5 |
| 2017 | 16.5 | 17.7 | 13.8 | 7.4 | 28.1 | 14.1 | 12.2 |
| 2018 | 17.2 | 19.0 | 14.7 | 8.1 | 28.8 | 15.2 | 13.0 |
| 2019 | 17.9 | 19.6 | 15.4 | 7.4 | 29.8 | 15.9 | 13.5 |
| 2020 | 19.4 | 21.2 | 17.8 | 8.4 | 31.3 | 17.4 | 15.0 |
| 2021 | 22.0 | 23.2 | 19.3 | 9.1 | 32.6 | 19.8 | 16.6 |
| 2022 | 22.8 | 24.7 | 20.6 | 9.5 | 33.5 | 21.0 | 17.6 |
| 2023 | 23.0 | 25.4 | 20.8 | 10.4 | 32.4 | 22.4 | 18.3 |
| 2024 | 23.7 | 26.1 | 21.7 | 11.7 | 33.0 | 24.1 | 19.4 |
In 2010 the region had 6.8 subscriptions per 100 people; by 2025 it reached 20.5, three times as many. Chile went from 10.4 to 23.7 and Peru from 3.2 to 11.7. In absolute terms, Brazil doubled its fixed connections between 2015 and 2024, from 25.5 to 51.0 million, and Mexico went from 14.8 to 28.4 million. The race shows how positions changed year by year:
View the data as a table
| 2010 | 2011 | 2012 | 2013 | 2014 | 2015 | 2016 | 2017 | 2018 | 2019 | 2020 | 2021 | 2022 | 2023 | 2024 | |
|---|---|---|---|---|---|---|---|---|---|---|---|---|---|---|---|
| Argentina | 9.8 | 11.0 | 12.2 | 14.7 | 15.2 | 15.8 | 16.5 | 17.7 | 19.0 | 19.6 | 21.2 | 23.2 | 24.7 | 25.4 | 26.1 |
| Bolivia | 0.9 | 0.7 | 1.1 | 1.4 | 1.6 | 1.6 | 2.6 | 3.4 | 4.4 | 6.4 | 7.9 | 9.5 | 11.0 | 11.2 | 12.1 |
| Brazil | 7.3 | 9.1 | 9.7 | 10.8 | 12.0 | 12.6 | 13.2 | 14.1 | 15.2 | 15.9 | 17.4 | 19.8 | 21.0 | 22.4 | 24.1 |
| Chile | 10.4 | 11.6 | 12.4 | 13.0 | 13.9 | 15.1 | 15.9 | 16.5 | 17.2 | 17.9 | 19.4 | 22.0 | 22.8 | 23.0 | 23.7 |
| Colombia | 5.9 | 7.4 | 8.6 | 9.8 | 10.8 | 11.8 | 12.5 | 13.2 | 13.6 | 13.9 | 15.3 | 16.5 | 17.0 | 17.0 | 17.2 |
| Costa Rica | 8.7 | 9.1 | 9.6 | 10.3 | 10.8 | 11.6 | 13.1 | 15.1 | 16.8 | 18.1 | 19.7 | 20.9 | 21.8 | 22.5 | 23.3 |
| Cuba | 0.0 | 0.0 | 0.0 | 0.1 | 0.1 | 0.1 | 0.1 | 0.3 | 0.9 | 1.6 | 2.1 | 2.7 | 2.9 | 3.0 | 3.1 |
| Dominican Republic | 4.0 | 4.3 | 4.8 | 5.2 | 5.8 | 6.6 | 7.2 | 7.7 | 8.0 | 8.5 | 9.4 | 10.3 | 10.7 | 11.1 | 11.2 |
| Ecuador | 1.5 | 4.3 | 5.4 | 6.7 | 8.2 | 9.2 | 9.8 | 10.6 | 11.5 | 12.1 | 13.5 | 14.0 | 15.1 | 16.1 | 17.3 |
| Honduras | 0.0 | 0.7 | 0.7 | 0.8 | 1.7 | 2.1 | 2.3 | 2.5 | 3.6 | 3.9 | 3.9 | 4.1 | 4.4 | 4.4 | 4.6 |
| Mexico | 9.3 | 10.0 | 11.2 | 10.8 | 10.9 | 12.2 | 13.0 | 13.8 | 14.7 | 15.4 | 17.8 | 19.3 | 20.6 | 20.8 | 21.7 |
| Nicaragua | 1.3 | 1.5 | 1.7 | 2.2 | 1.8 | 1.9 | 2.8 | 3.3 | 3.0 | 3.4 | 4.4 | 4.5 | 5.0 | 5.4 | 5.8 |
| Peru | 3.2 | 4.1 | 4.9 | 5.4 | 5.9 | 6.6 | 6.9 | 7.4 | 8.1 | 7.4 | 8.4 | 9.1 | 9.5 | 10.4 | 11.7 |
| El Salvador | 2.9 | 3.4 | 4.0 | 4.6 | 5.2 | 5.7 | 6.4 | 7.3 | 7.9 | 8.4 | 8.5 | 9.1 | 9.7 | 11.6 | 12.5 |
| Uruguay | 11.6 | 14.2 | 17.4 | 22.0 | 25.0 | 26.8 | 27.3 | 28.1 | 28.8 | 29.8 | 31.3 | 32.6 | 33.5 | 32.4 | 33.0 |
| Venezuela | 5.8 | 6.2 | 6.9 | 7.5 | 7.9 | 8.5 | 8.5 | 8.5 | 8.7 | 8.9 | 9.0 | 9.2 | 9.6 | 10.6 | 12.9 |
| Country | 2010 | 2015 | 2020 | 2024 |
|---|---|---|---|---|
| Uruguay | 11.6 | 26.8 | 31.3 | 33.0 |
| Argentina | 9.8 | 15.8 | 21.2 | 26.1 |
| Brazil | 7.3 | 12.6 | 17.4 | 24.1 |
| Chile | 10.4 | 15.1 | 19.4 | 23.7 |
| Mexico | 9.3 | 12.2 | 17.8 | 21.7 |
| Peru | 3.2 | 6.6 | 8.4 | 11.7 |
| Latin America and the Caribbean | 6.8 | 10.8 | 15.0 | 19.4 |
Source: ITU via the World Bank, IT.NET.BBND.P2. Uruguay has led every year since 2010. Chile was second until 2012: Argentina overtook it in 2013 and Brazil in 2024. For the speed of those connections, see the internet speed ranking.
Which countries added the most fixed broadband since 2019
Between 2019 and 2024, Brazil made the most progress: it added 8.2 subscriptions per 100 people and climbed from fifth to third place. Argentina (6.6) and Mexico (6.4) follow. Chile added 5.9, almost the same as the regional average, and Uruguay, which already started very high, just 3.2. Honduras grew the least: 0.7 points in five years.
| Country | 2019 | 2024 | Increase (points) |
|---|---|---|---|
| Brazil | 15.9 | 24.1 | +8.2 |
| Argentina | 19.6 | 26.1 | +6.6 |
| Mexico | 15.4 | 21.7 | +6.4 |
| Chile | 17.9 | 23.7 | +5.9 |
| Peru | 7.4 | 11.7 | +4.3 |
| Uruguay | 29.8 | 33.0 | +3.2 |
| Honduras | 3.9 | 4.6 | +0.7 |
Source: ITU via the World Bank, IT.NET.BBND.P2; differences calculated by Vivarae News from unrounded values.
Fixed broadband and income per person in Latin America
View the data as a table
| GDP per capita 2025 (US$) | Fixed broadband per 100 people | |
|---|---|---|
| Uruguay | 25,216.0 | 33.0 |
| Argentina | 14,898.0 | 26.1 |
| Brazil | 10,713.0 | 24.1 |
| Chile | 17,995.0 | 23.7 |
| Costa Rica | 19,970.0 | 23.3 |
| Mexico | 13,889.0 | 21.7 |
| Panama | 19,790.0 | 18.1 |
| Ecuador | 7,125.0 | 17.3 |
| Colombia | 8,562.0 | 17.2 |
| Venezuela | 3,495.0 | 13.0 |
| Paraguay | 7,027.0 | 12.9 |
| El Salvador | 5,767.0 | 12.5 |
| Bolivia | 5,148.0 | 12.1 |
| Peru | 9,684.0 | 11.7 |
| Dominican Republic | 11,059.0 | 11.2 |
| Nicaragua | 3,173.0 | 5.8 |
| Guatemala | 6,598.0 | 5.3 |
| Honduras | 3,598.0 | 4.6 |
| Cuba | 9,605.0 | 3.1 |
Richer countries tend to have more broadband, but there are exceptions. Argentina, with GDP per capita of $14,898 in 2025, has more subscriptions than Chile ($17,995) and Costa Rica ($19,970). Panama, with income similar to Costa Rica's, stands at 18.1. At the other end, Venezuela, with GDP per capita of $3,495, has 12.9, more than Peru or the Dominican Republic.
Fixed broadband versus mobile phones
| Uruguay | 33.0 | 1,119 | 145.5 | 25,216 |
| Argentina | 26.1 | 11,926 | 140.2 | 14,898 |
| Brazil | 24.1 | 51,048 | 101.9 | 10,713 |
| Chile | 23.7 | 4,690 | 132.7 | 17,995 |
| Costa Rica | 23.3 | 1,195 | 136.0 | 19,970 |
| Mexico | 21.7 | 28,445 | 116.5 | 13,889 |
| Panama | 18.1 | 809 | 156.6 | 19,790 |
| Ecuador | 17.3 | 3,128 | 101.6 | 7,125 |
| Colombia | 17.2 | 9,109 | 174.1 | 8,562 |
| Venezuela | 13.0 | 3,677 | 71.0 | 3,495 |
| Paraguay | 12.9 | 882 | 126.6 | 7,027 |
| El Salvador | 12.5 | 790 | 176.5 | 5,767 |
| Bolivia | 12.1 | 1,498 | 98.0 | 5,148 |
| Peru | 11.7 | 3,996 | 124.6 | 9,684 |
| Dominican Republic | 11.2 | 1,280 | 93.7 | 11,059 |
| Nicaragua | 5.8 | 399 | 106.0 | 3,173 |
| Guatemala | 5.3 | 983 | 112.5 | 6,598 |
| Honduras | 4.6 | 496 | 70.9 | 3,598 |
| Cuba | 3.1 | 339 | 72.9 | 9,605 |
Sources: ITU via the World Bank; mobile phones, IT.CEL.SETS.P2; GDP per capita, NY.GDP.PCAP.CD. The region has far more mobile lines than fixed connections: El Salvador (176.5) and Colombia (174.1) exceed 170 lines per 100 people, and Chile has 132.7. For millions of people, the phone is the main or only way to get online.

How to cite this data
Vivarae News (2026). "Fixed broadband in Latin America: ranking by country 2026". Updated November 7, 2026. Available at https://vivaraenews.com/en/fixed-broadband-in-latin-america-ranking-by-country-2026/. The data may be reproduced citing Vivarae News and linking to this page; country figures come from the International Telecommunication Union, published by the World Bank.
Frequently asked questions
Which Latin American country has the most fixed broadband?
Uruguay, with 33.0 subscriptions per 100 people in 2024, according to the ITU via the World Bank. Argentina (26.1) and Brazil (24.1) follow.
Where does Chile rank?
Fourth, with 23.7 subscriptions per 100 people and 4.69 million fixed connections in 2024.
Which country has the most fixed connections in total?
Brazil, with 51.0 million subscriptions in 2024, followed by Mexico (28.4 million) and Argentina (11.9 million).
What is the Latin American average?
20.5 subscriptions per 100 people in 2025, versus 20.1 worldwide, according to the World Bank.
What does fixed broadband measure?
Fixed internet subscriptions of at least 256 kbit/s, via cable, fiber, DSL, satellite or fixed wireless. It does not include mobile connections.