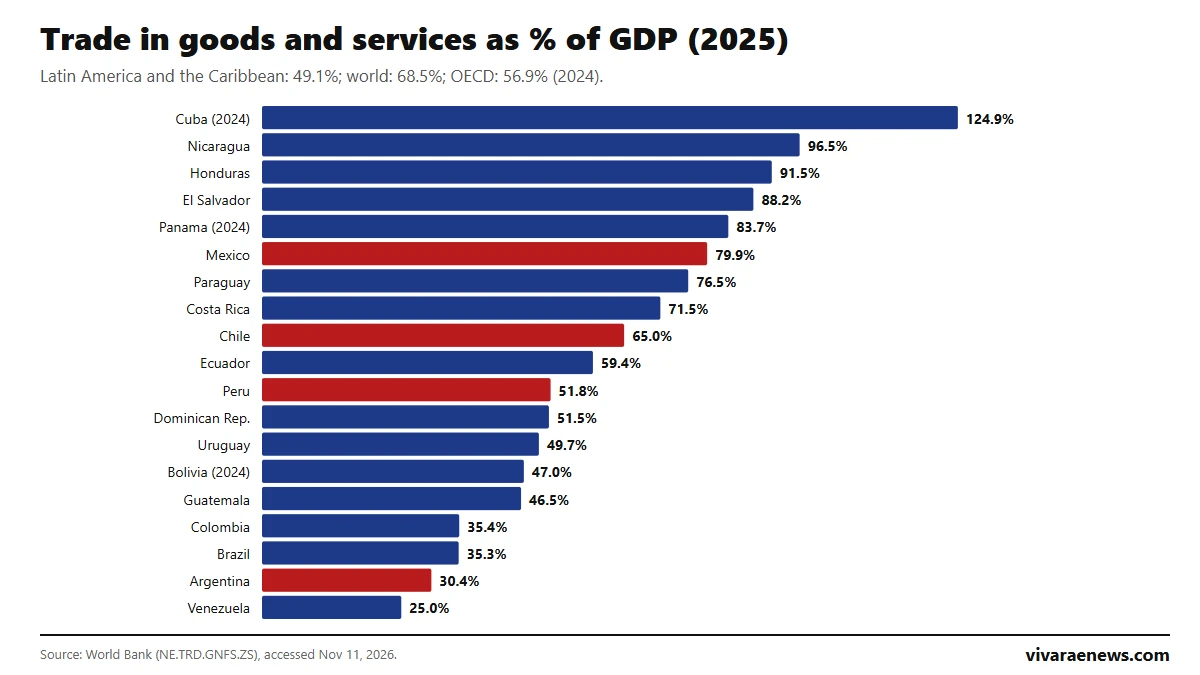
Cuba is the Latin American country with the highest trade openness according to the World Bank: its exports plus imports of goods and services equal 124.9% of GDP (2024 data), followed by Nicaragua (96.5%). Among large economies, Mexico is the most open, at 79.9% in 2025 (rank 6 of 19); Chile is at 65.0% (rank 9), Peru 51.8%, Brazil 35.3% and Argentina 30.4%.
Trade openness measures how much foreign trade weighs in an economy. Small economies tend to score higher because they buy and sell abroad much of what they cannot produce at home. Latin America and the Caribbean average 49.1% in 2025, below the world average of 68.5%. This ranking of trade openness in Latin America is updated on this same page when the World Bank publishes new data.
View the data as a table
| México | 79.9% |
| Chile | 65.0% |
| Latin America and the Caribbean | 49.1% |
| World | 68.5% |
Ranking of trade openness in Latin America
| Rank | Country | Trade (% of GDP) | 2015 | Year |
|---|---|---|---|---|
| 1 | Cuba | 124.9% | 31.6% | 2024 |
| 2 | Nicaragua | 96.5% | 98.2% | 2025 |
| 3 | Honduras | 91.5% | 107.3% | 2025 |
| 4 | El Salvador | 88.2% | 76.6% | 2025 |
| 5 | Panama | 83.7% | 96.6% | 2024 |
| 6 | Mexico | 79.9% | 70.4% | 2025 |
| 7 | Paraguay | 76.5% | 66.9% | 2025 |
| 8 | Costa Rica | 71.5% | 60.8% | 2025 |
| 9 | Chile | 65.0% | 59.4% | 2025 |
| 10 | Ecuador | 59.4% | 47.8% | 2025 |
| 11 | Peru | 51.8% | 45.2% | 2025 |
| 12 | Dominican Rep. | 51.5% | 52.4% | 2025 |
| 13 | Uruguay | 49.7% | 45.3% | 2025 |
| 14 | Bolivia | 47.0% | 67.9% | 2024 |
| 15 | Guatemala | 46.5% | 49.9% | 2025 |
| 16 | Colombia | 35.4% | 38.4% | 2025 |
| 17 | Brazil | 35.3% | 26.9% | 2025 |
| 18 | Argentina | 30.4% | 22.5% | 2025 |
| 19 | Venezuela | 25.0% | 60.4% | 2025 |
Source: World Bank, trade in goods and services as % of GDP (NE.TRD.GNFS.ZS), accessed November 11, 2026. 2025 data; Cuba, Panama and Bolivia, 2024. The indicator adds exports and imports and divides them by GDP, which is why it can exceed 100%. In Cuba, the result depends on the official exchange rate used to express GDP, and Venezuela's series swings widely; both figures should be treated with caution.
View the data as a table
| Cuba | 124.9% · 2024 |
| Nicaragua | 96.5% · 2025 |
| Honduras | 91.5% · 2025 |
| El Salvador | 88.2% · 2025 |
| Panama | 83.7% · 2024 |
| Mexico | 79.9% · 2025 |
| Paraguay | 76.5% · 2025 |
| Costa Rica | 71.5% · 2025 |
| Chile | 65.0% · 2025 |
| Ecuador | 59.4% · 2025 |
| Peru | 51.8% · 2025 |
| Dominican Republic | 51.5% · 2025 |
| Uruguay | 49.7% · 2025 |
| Bolivia | 47.0% · 2024 |
| Guatemala | 46.5% · 2025 |
| Colombia | 35.4% · 2025 |
| Brazil | 35.3% · 2025 |
| Argentina | 30.4% · 2025 |
| Venezuela | 25.0% · 2025 |
How trade openness has changed since 1991
Mexico is the clearest case of opening up: its trade went from 35.8% of GDP in 1991, before the agreement with the United States and Canada, to 79.9% in 2025. Peru rose from 26.7% to 51.8%, and Brazil from 16.6% to 35.3%. Chile was already an open economy in 1991 (57.5%) and is now at 65.0%. Argentina and Brazil remain the region's most closed large economies: Argentina went from 13.8% to 30.4%, with big swings due to its currency crises:
View the data as a table
| Mexico | Chile | Peru | Brazil | Argentina | Latin America and the Caribbean | |
|---|---|---|---|---|---|---|
| 1991 | 35.8% | 57.5% | 26.7% | 16.6% | 13.8% | 29.6% |
| 1995 | 43.7% | 54.7% | 30.9% | 17.0% | 19.8% | 32.1% |
| 2000 | 49.9% | 58.7% | 35.5% | 22.6% | 22.6% | 36.3% |
| 2005 | 52.6% | 72.1% | 47.4% | 27.1% | 40.5% | 42.5% |
| 2010 | 59.3% | 69.7% | 51.7% | 22.8% | 35.0% | 41.4% |
| 2015 | 70.4% | 59.4% | 45.2% | 26.9% | 22.5% | 45.0% |
| 2020 | 76.8% | 58.2% | 44.3% | 32.3% | 30.2% | 46.0% |
| 2025 | 79.9% | 65.0% | 51.8% | 35.3% | 30.4% | 49.1% |
| Country | 1991 | 1995 | 2000 | 2005 | 2010 | 2015 | 2020 | 2025 |
|---|---|---|---|---|---|---|---|---|
| Mexico | 35.8 | 43.7 | 49.9 | 52.6 | 59.3 | 70.4 | 76.8 | 79.9 |
| Chile | 57.5 | 54.7 | 58.7 | 72.1 | 69.7 | 59.4 | 58.2 | 65.0 |
| Peru | 26.7 | 30.9 | 35.5 | 47.4 | 51.7 | 45.2 | 44.3 | 51.8 |
| Brazil | 16.6 | 17.0 | 22.6 | 27.1 | 22.8 | 26.9 | 32.3 | 35.3 |
| Argentina | 13.8 | 19.8 | 22.6 | 40.5 | 35.0 | 22.5 | 30.2 | 30.4 |
Source: World Bank, trade in goods and services as % of GDP (NE.TRD.GNFS.ZS), accessed November 11, 2026; percent of GDP. A high score does not by itself mean a more competitive economy: it also rises when GDP or the exchange rate falls, or when the commodities a country exports or imports become more expensive. For where those sales go, see the rankings of exports to the United States and foreign direct investment; on trade taxes, see what a tariff is.
Trade openness in Chile, Mexico, Argentina and Peru
Over the last decade, Mexico kept opening up (from 70.4% of GDP in 2015 to 79.9% in 2025), as did Peru (from 45.2% to 51.8%), Chile (from 59.4% to 65.0%) and Argentina (from 22.5% to 30.4%). Even so, only Mexico and Chile are above the OECD average (56.9% in 2024), and only Mexico beats the world average.

Frequently asked questions
What is trade openness?
The sum of exports and imports of goods and services divided by GDP. It shows how much foreign trade weighs in an economy.
Which is Latin America's most open economy?
Cuba, at 124.9% of GDP (2024). Among large economies, Mexico, at 79.9%.
How much does trade weigh in Chile?
65.0% of GDP in 2025, according to the World Bank.
How often is this ranking updated?
When the World Bank publishes new data, usually once a year. It is updated at this same URL.
How to cite this data
Vivarae News (2026). "Trade openness in Latin America: ranking by country 2026". Updated November 11, 2026. Available at https://vivaraenews.com/en/trade-openness-in-latin-america-ranking-by-country-2026/. The data may be reproduced by citing Vivarae News and linking to this page; each country's figures come from the World Bank.