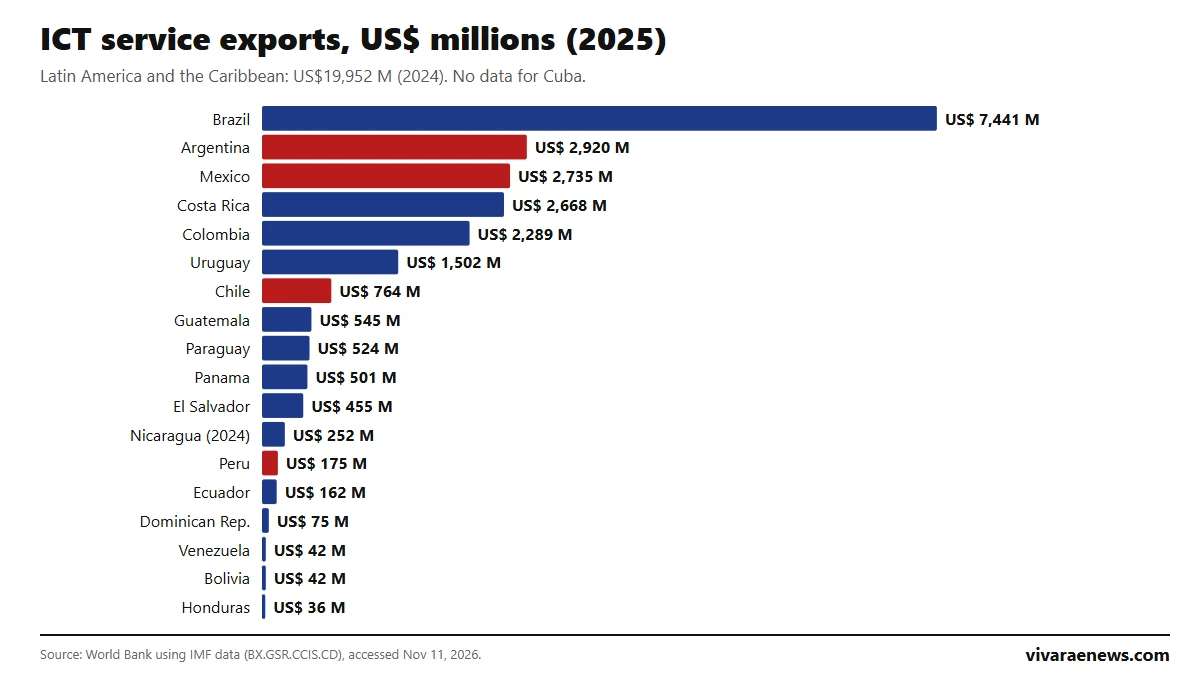
Brazil is Latin America's largest exporter of information and communication technology (ICT) services, with US$7,441 million in 2025, followed by Argentina (US$2,920 million), Mexico (US$2,735 million) and Costa Rica (US$2,668 million), according to the World Bank. Chile exported US$764 million and ranks 7 of 18; Peru, US$175 million (rank 13).
ICT services include software development, computer and data services and telecommunications that a country sells abroad. In 2024, Latin America and the Caribbean exported US$19,952 million, just 1.6% of the world total (US$1,280 billion). This ranking of ICT service exports in Latin America is updated on this same page when the World Bank publishes new data.
View the data as a table
| Brasil | US$ 7,441 M |
| Chile | US$ 764 M |
| Uruguay | 20.3% |
| Latin America and the Caribbean | US$ 19,952 M |
Ranking of ICT service exports in Latin America
| Rank | Country | ICT exports (US$ millions) | % of service exports | Year |
|---|---|---|---|---|
| 1 | Brazil | 7,441 | 13.7% | 2025 |
| 2 | Argentina | 2,920 | 15.9% | 2025 |
| 3 | Mexico | 2,735 | 4.2% | 2025 |
| 4 | Costa Rica | 2,668 | 14.8% | 2025 |
| 5 | Colombia | 2,289 | 11.5% | 2025 |
| 6 | Uruguay | 1,502 | 20.3% | 2025 |
| 7 | Chile | 764 | 5.9% | 2025 |
| 8 | Guatemala | 545 | 11.2% | 2025 |
| 9 | Paraguay | 524 | 14.1% | 2025 |
| 10 | Panama | 501 | 2.5% | 2025 |
| 11 | El Salvador | 455 | 7.3% | 2025 |
| 12 | Nicaragua | 252 | 19.4% | 2024 |
| 13 | Peru | 175 | 2.3% | 2025 |
| 14 | Ecuador | 162 | 3.9% | 2025 |
| 15 | Dominican Rep. | 75 | 0.5% | 2025 |
| 16 | Venezuela | 42 | 3.7% | 2025 |
| 17 | Bolivia | 42 | 3.3% | 2025 |
| 18 | Honduras | 36 | 0.9% | 2025 |
Source: World Bank, using IMF balance of payments data (BX.GSR.CCIS.CD and BX.GSR.CCIS.ZS), accessed November 11, 2026. 2025 data; Nicaragua, 2024. No data for Cuba. Figures are in current dollars and come from each country's balance of payments. Sharp year-to-year jumps, such as Paraguay's (from US$15 million in 2015 to US$524 million in 2025) or the drop in Honduras, may reflect changes in how each central bank measures them.
View the data as a table
| Brazil | US$ 7,441 · 2025 |
| Argentina | US$ 2,920 · 2025 |
| Mexico | US$ 2,735 · 2025 |
| Costa Rica | US$ 2,668 · 2025 |
| Colombia | US$ 2,289 · 2025 |
| Uruguay | US$ 1,502 · 2025 |
| Chile | US$ 764 · 2025 |
| Guatemala | US$ 545 · 2025 |
| Paraguay | US$ 524 · 2025 |
| Panama | US$ 501 · 2025 |
| El Salvador | US$ 455 · 2025 |
| Nicaragua | US$ 252 · 2024 |
| Peru | US$ 175 · 2025 |
| Ecuador | US$ 162 · 2025 |
| Dominican Republic | US$ 75 · 2025 |
| Venezuela | US$ 42 · 2025 |
| Bolivia | US$ 42 · 2025 |
| Honduras | US$ 36 · 2025 |

Which countries rely most on ICT service exports
Measured as a share of all service exports, the ranking changes. Uruguay leads with 20.3%: one in five dollars it earns selling services abroad comes from ICT. It is followed by Nicaragua (19.4%), Argentina (15.9%) and Costa Rica (14.8%). In Chile the share is 5.9%, in Mexico 4.2% and in Peru 2.3%. The regional average is 8.4% and the world average 15.7%:
How ICT service exports have grown since 2005
Between 2015 and 2025, Brazil multiplied its ICT service exports by 4.7, Colombia by 4.4, Uruguay by 3.4 and Mexico by 2.7. Chile went from US$317 million to US$764 million (x2.4) and Peru from US$122 million to US$175 million. Costa Rica, with 5 million people, exports almost as much as Mexico, reflecting the multinational service centers based there.
View the data as a table
| Brazil | Argentina | Mexico | Costa Rica | Colombia | Chile | |
|---|---|---|---|---|---|---|
| 2005 | 319 | 408 | 717 | 218 | 215 | 234 |
| 2010 | 611 | 1,410 | 607 | 538 | 467 | 286 |
| 2015 | 1,571 | 1,473 | 1,001 | 1,002 | 517 | 317 |
| 2019 | 2,574 | 2,090 | 1,314 | 1,239 | 527 | 383 |
| 2021 | 3,301 | 2,360 | 1,617 | 1,511 | 658 | 496 |
| 2023 | 5,783 | 2,623 | 1,190 | 2,172 | 1,765 | 610 |
| 2025 | 7,441 | 2,920 | 2,735 | 2,668 | 2,289 | 764 |
| Country | 2005 | 2010 | 2015 | 2019 | 2021 | 2023 | 2025 |
|---|---|---|---|---|---|---|---|
| Brazil | 319 | 611 | 1,571 | 2,574 | 3,301 | 5,783 | 7,441 |
| Argentina | 408 | 1,410 | 1,473 | 2,090 | 2,360 | 2,623 | 2,920 |
| Mexico | 717 | 607 | 1,001 | 1,314 | 1,617 | 1,190 | 2,735 |
| Costa Rica | 218 | 538 | 1,002 | 1,239 | 1,511 | 2,172 | 2,668 |
| Colombia | 215 | 467 | 517 | 527 | 658 | 1,765 | 2,289 |
| Chile | 234 | 286 | 317 | 383 | 496 | 610 | 764 |
| Peru | 69 | 125 | 122 | 113 | 115 | 131 | 175 |
Source: World Bank, using IMF balance of payments data (BX.GSR.CCIS.CD and BX.GSR.CCIS.ZS), accessed November 11, 2026; millions of current dollars. For other indicators of the region's digital economy, see the rankings of high-tech exports and internet use in Latin America.
ICT service exports from Chile, Mexico, Argentina and Peru
Since 2005, Argentina has multiplied its ICT service exports by 7.2, Mexico by 3.8, Chile by 3.3 and Peru by 2.5. Argentina and Mexico now export almost four times as much as Chile, and Peru less than a quarter of Chile's figure. Measured against total services, Argentina is the only one of the four above the world average (15.9% versus 15.7%).

Frequently asked questions
Which Latin American country exports the most ICT services?
Brazil, with US$7,441 million in 2025, according to the World Bank.
How much does Chile export in ICT services?
US$764 million in 2025, 5.9% of its service exports.
What do ICT services include?
Computer services (software, consulting, data processing), information services and telecommunications sold to non-residents.
How often is this ranking updated?
When the World Bank publishes new data, usually once a year. It is updated at this same URL.
How to cite this data
Vivarae News (2026). "ICT service exports in Latin America: ranking by country 2026". Updated November 11, 2026. Available at https://vivaraenews.com/en/ict-service-exports-in-latin-america-ranking-by-country-2026/. The data may be reproduced by citing Vivarae News and linking to this page; each country's figures come from the World Bank, using IMF balance of payments data.