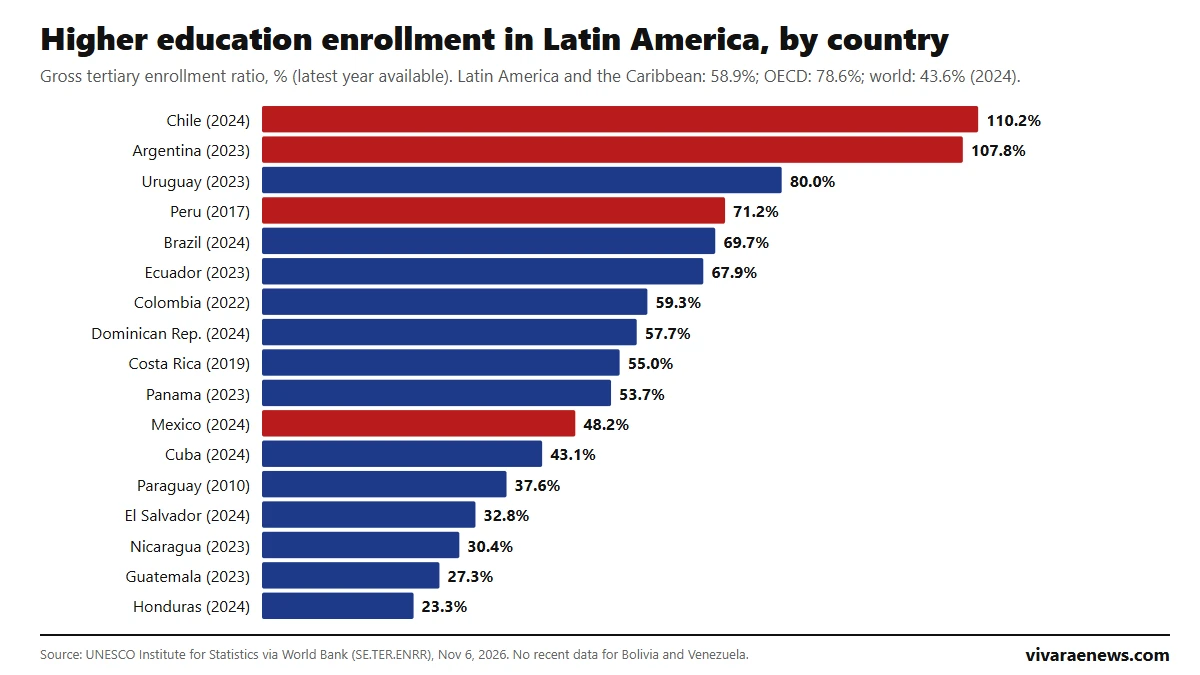
Chile has the highest gross enrollment ratio in higher education in Latin America: 110.2% in 2024, according to UNESCO Institute for Statistics data published by the World Bank. It is followed by Argentina (107.8% in 2023) and Uruguay (80.0%), while the Latin America and Caribbean average is 58.9%, the OECD's 78.6% and the world's 43.6%. At the other end are Honduras (23.3%) and Guatemala (27.3%).
The gross ratio compares the total number of students enrolled in universities, institutes and technical centers, regardless of age, with the population of the theoretical age for that level. That is why it can exceed 100%: in Chile and Argentina many people over 24 are studying. This ranking brings together the latest data available for 17 countries, the gap between women and men, the trend since 2000 and Chile's most recent figures.
Ranking of higher education enrollment in Latin America
View the data as a table
| Chile | 110.2% · Data from 2024 |
| Argentina | 107.8% · Data from 2023 |
| Uruguay | 80.0% · Data from 2023 |
| Peru | 71.2% · Data from 2017 |
| Brazil | 69.7% · Data from 2024 |
| Ecuador | 67.9% · Data from 2023 |
| Colombia | 59.3% · Data from 2022 |
| Dominican Republic | 57.7% · Data from 2024 |
| Costa Rica | 55.0% · Data from 2019 |
| Panama | 53.7% · Data from 2023 |
| Mexico | 48.2% · Data from 2024 |
| Cuba | 43.1% · Data from 2024 |
| Paraguay | 37.6% · Data from 2010 |
| El Salvador | 32.8% · Data from 2024 |
| Nicaragua | 30.4% · Data from 2023 |
| Guatemala | 27.3% · Data from 2023 |
| Honduras | 23.3% · Data from 2024 |
| Rank | Country | Gross tertiary enrollment ratio | Year of data |
|---|---|---|---|
| 1 | Chile | 110.2% | 2024 |
| 2 | Argentina | 107.8% | 2023 |
| 3 | Uruguay | 80.0% | 2023 |
| 4 | Peru | 71.2% | 2017 |
| 5 | Brazil | 69.7% | 2024 |
| 6 | Ecuador | 67.9% | 2023 |
| 7 | Colombia | 59.3% | 2022 |
| 8 | Dominican Republic | 57.7% | 2024 |
| 9 | Costa Rica | 55.0% | 2019 |
| 10 | Panama | 53.7% | 2023 |
| 11 | Mexico | 48.2% | 2024 |
| 12 | Cuba | 43.1% | 2024 |
| 13 | Paraguay | 37.6% | 2010 |
| 14 | El Salvador | 32.8% | 2024 |
| 15 | Nicaragua | 30.4% | 2023 |
| 16 | Guatemala | 27.3% | 2023 |
| 17 | Honduras | 23.3% | 2024 |
Source: UNESCO Institute for Statistics via the World Bank, indicator SE.TER.ENRR, retrieved November 6, 2026. Bolivia and Venezuela have no recent data: Venezuela's latest is from 2009. Those for Peru (2017), Paraguay (2010) and Costa Rica (2019) are old and should be read with caution.
How higher education enrollment has grown since 2000
The region's leap in a quarter century is large. The Latin America and Caribbean ratio rose from 23.8% in 2000 to 58.9% in 2024, and Chile tripled it: from 35.4% to 110.2%. Mexico, the largest Spanish-speaking economy, went from 20.5% to 48.2%, still below the regional average.
View the data as a table
| Chile | Mexico | Latin America and the Caribbean | OECD | |
|---|---|---|---|---|
| 2002 | 40.3% | 22.3% | 27.1% | 57.1% |
| 2003 | 43.5% | 23.1% | 28.7% | 58.8% |
| 2004 | 44.3% | 23.7% | 30.1% | 60.1% |
| 2005 | 50.3% | 24.1% | 31.8% | 61.0% |
| 2006 | 49.3% | 24.6% | 38.6% | 62.3% |
| 2007 | 54.7% | 25.2% | 36.4% | 63.1% |
| 2008 | 56.8% | 25.8% | 39.3% | 63.7% |
| 2009 | 60.0% | 26.2% | 40.3% | 65.3% |
| 2010 | 66.3% | 27.2% | 41.8% | 66.8% |
| 2011 | 70.8% | 28.0% | 43.3% | 67.9% |
| 2012 | 75.1% | 29.4% | 44.4% | 68.9% |
| 2013 | 79.9% | 30.3% | 45.5% | 69.9% |
| 2014 | 83.7% | 31.2% | 47.1% | 70.9% |
| 2015 | 86.4% | 32.0% | 48.4% | 72.0% |
| 2016 | 88.9% | 38.6% | 50.4% | 73.9% |
| 2017 | 89.9% | 40.3% | 51.8% | 74.8% |
| 2018 | 91.2% | 41.6% | 52.5% | 75.5% |
| 2019 | 92.1% | 43.0% | 53.4% | 76.4% |
| 2020 | 89.1% | 45.2% | 54.9% | 77.3% |
| 2021 | 96.2% | 45.7% | 56.8% | 78.9% |
| 2022 | 99.3% | 46.4% | 58.2% | 78.4% |
| 2023 | 104.7% | 47.5% | 60.6% | 79.5% |
| 2024 | 110.2% | 48.2% | 58.9% | 78.6% |
| Year | Chile | Argentina | Mexico | Latin America and the Caribbean | OECD |
|---|---|---|---|---|---|
| 2000 | 35.4% | 54.1% | 20.5% | 23.8% | 52.6% |
| 2005 | 50.3% | 63.5% | 24.1% | 31.8% | 61.0% |
| 2010 | 66.3% | 73.8% | 27.2% | 41.8% | 66.8% |
| 2015 | 86.4% | 83.8% | 32.0% | 48.4% | 72.0% |
| 2020 | 89.1% | 99.4% | 45.2% | 54.9% | 77.3% |
| 2024 | 110.2% | n/a | 48.2% | 58.9% | 78.6% |
Source: UNESCO Institute for Statistics via the World Bank, indicator SE.TER.ENRR, retrieved November 6, 2026. "n/a": no data that year. Argentina has no data for 2024; its latest figure, for 2023, is 107.8%.
Women and men in Latin American higher education
Across the region, more women than men enroll in higher education. In Latin America and the Caribbean, the female gross ratio is 69.1% and the male 49.0%, a 20-point gap. The largest gap is in Argentina (140.2% versus 76.9%), followed by Uruguay (101.6% versus 59.2%), and in the Dominican Republic the women's ratio is almost double the men's (76.6% versus 38.9%).
| Chile | 110.2% | 119.4% | 101.2% | 2024 |
| Argentina | 107.8% | 140.2% | 76.9% | 2023 |
| Uruguay | 80.0% | 101.6% | 59.2% | 2023 |
| Peru | 71.2% | 74.0% | 68.4% | 2017 |
| Brazil | 69.7% | 85.3% | 55.0% | 2024 |
| Ecuador | 67.9% | 76.1% | 60.0% | 2023 |
| Colombia | 59.3% | 64.3% | 54.4% | 2022 |
| Dominican Republic | 57.7% | 76.6% | 38.9% | 2024 |
| Costa Rica | 55.0% | 60.5% | 49.8% | 2019 |
| Panama | 53.7% | 66.3% | 41.6% | 2023 |
| Mexico | 48.2% | 52.4% | 44.0% | 2024 |
| Cuba | 43.1% | 57.6% | 29.2% | 2024 |
| Paraguay | 37.6% | 44.3% | 31.2% | 2010 |
| El Salvador | 32.8% | 37.9% | 28.0% | 2024 |
| Nicaragua | 30.4% | 35.7% | 25.2% | 2023 |
| Guatemala | 27.3% | 30.5% | 24.1% | 2023 |
| Honduras | 23.3% | 28.1% | 18.8% | 2024 |
In Chile, the women's ratio is 119.4% and the men's 101.2%. Chile's 18-point gap is smaller than the regional average. For the labor market picture, see the ranking of female labor force participation in Latin America.

Higher education enrollment in Chile in 2026
The World Bank data run through 2024. For 2026, the enrollment report of the Higher Education Information Service (SIES), published in July, counts 1,497,548 enrollments in undergraduate, graduate and postgraduate certificate programs, 3.0% more than in 2025 and almost double 2007, when there were 776,838.
View the data as a table
| Total enrollment (undergraduate, graduate and certificates) | 1,497,548 |
| Undergraduate enrollment | 1,372,167 |
| Women in total enrollment | 53.3% |
| Distance undergraduate programs | 15.1% |
View the data as a table
| Universities | Professional institutes | Technical training centers | |
|---|---|---|---|
| 2022 | 774.7 | 397.7 | 131.8 |
| 2023 | 785.3 | 419.4 | 136.8 |
| 2024 | 814.3 | 426.5 | 145.3 |
| 2025 | 859.1 | 442.6 | 152.5 |
| 2026 | 882.9 | 510.5 | 104.1 |
| Type of institution | 2022 | 2025 | 2026 | Change 2025-2026 |
|---|---|---|---|---|
| Universities | 774,688 | 859,093 | 882,893 | +2.8% |
| Professional institutes | 397,705 | 442,641 | 510,532 | +15.3% |
| Technical training centers | 131,754 | 152,545 | 104,123 | -31.7% |
| Total | 1,304,147 | 1,454,279 | 1,497,548 | +3.0% |
Source: SIES, 2026 Enrollment Report. The jump in professional institutes and the drop in technical training centers are largely explained by Inacap moving its higher-level technical programs from its CFT to its professional institute. The report highlights two other changes: distance undergraduate enrollment has grown 84.5% since 2022, and people aged 40 or older account for 115,359 enrollments, 12.4% more than in 2025. If you are choosing a degree, see how much graduates earn in Nursing Technician, Occupational Therapy and Speech-Language Therapy, and the ranking of education spending in Latin America.

How to read the gross enrollment ratio in higher education
UNESCO defines the gross enrollment ratio as the number of students at a level, regardless of age, divided by the population of the age group that officially corresponds to that level. For tertiary education, it uses the five-year age group following the end of secondary school, generally ages 18 to 22 or 19 to 23. Three caveats when comparing countries:
- It can exceed 100%: when there are many students older than the theoretical age, repeaters or long programs, as in Chile and Argentina.
- It does not measure quality or graduation: it counts enrollments, not graduates or learning.
- The years do not match: each country reports with a different lag, so the ranking shows the year of each figure.
How to cite this data
Vivarae News (2026). "Higher education enrollment in Latin America: ranking by country 2026". Updated November 6, 2026. Available at https://vivaraenews.com/en/higher-education-enrollment-in-latin-america-ranking-by-country-2026/. The data may be reproduced citing Vivarae News and linking to this page; country figures come from the UNESCO Institute for Statistics, published by the World Bank, and Chile's 2026 figures from SIES.
Frequently asked questions
Which Latin American country has the highest higher education enrollment?
Chile, with a gross ratio of 110.2% in 2024, according to UNESCO via the World Bank. It is followed by Argentina (107.8% in 2023) and Uruguay (80.0%).
Why does Chile's enrollment ratio exceed 100%?
Because the gross ratio counts all students, regardless of age, and divides them by the population of theoretical study age. Chile has many students over 24.
How many higher education students are there in Chile?
1,497,548 enrollments in 2026, including undergraduate, graduate and certificate programs, according to the SIES report of July 2026.
What is the Latin American average?
The gross tertiary enrollment ratio for Latin America and the Caribbean was 58.9% in 2024, against 78.6% in the OECD and 43.6% worldwide.
Do more women or men study in Latin America?
Women: their regional gross ratio is 69.1%, against 49.0% for men, and they are the majority in every country with data.