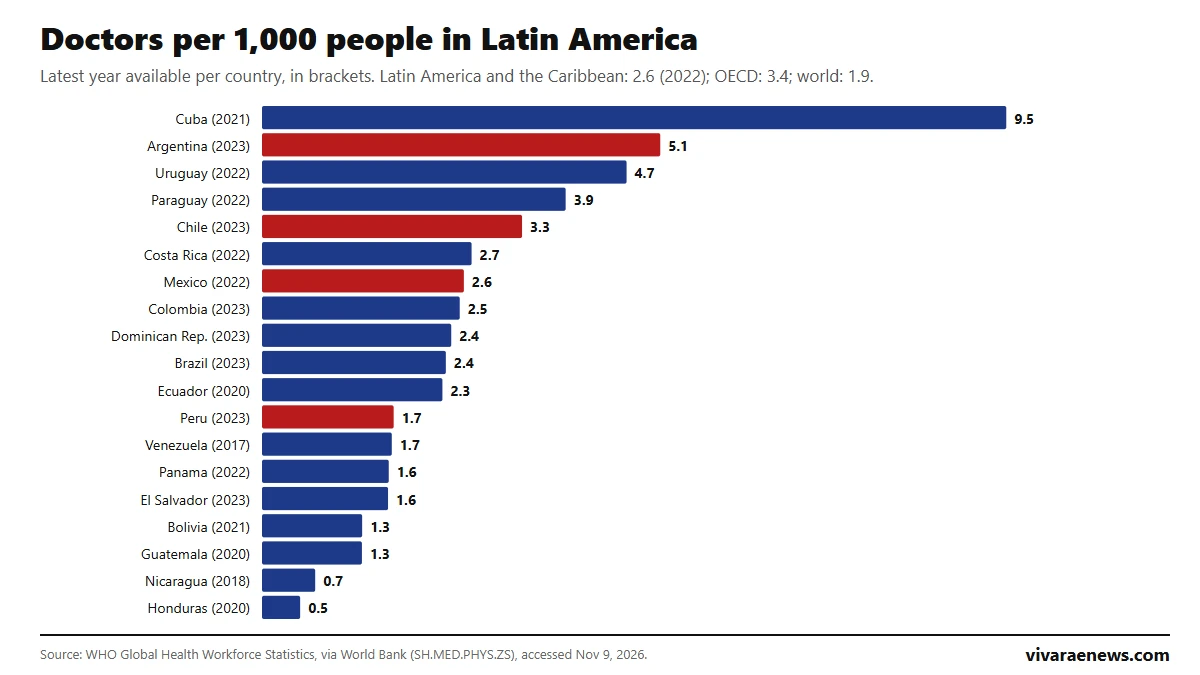
Cuba is the Latin American country with the most doctors per person: 9.5 per 1,000 people in 2021, followed by Argentina (5.1, 2023), Uruguay (4.7, 2022) and Paraguay (3.9, 2022), according to WHO health workforce statistics published by the WHO via the World Bank. Chile ranks fifth with 3.3, Mexico seventh with 2.6 and Peru twelfth with 1.7. The Latin America and Caribbean average is 2.6 doctors per 1,000 people (2022), versus 3.4 in OECD countries and 1.9 worldwide.
The indicator counts practicing general practitioners and specialists per 1,000 people, based on data each country reports to the WHO. Not every country reports every year: the ranking uses each one's latest available figure, which ranges from 2017 (Venezuela) to 2023, so the year appears next to each number. In Honduras, last in the ranking, there are 0.49 doctors per 1,000 people, fewer than one per 2,000 residents.
View the data as a table
| Cuba, first | 9.5 |
| Latin America and the Caribbean | 2.6 |
| Chile | 3.3 |
| Honduras, last | 0.5 |
Ranking of doctors per capita in Latin America
| Rank | Country | Doctors per 1,000 people | Data year |
|---|---|---|---|
| 1 | Cuba | 9.54 | 2021 |
| 2 | Argentina | 5.11 | 2023 |
| 3 | Uruguay | 4.67 | 2022 |
| 4 | Paraguay | 3.89 | 2022 |
| 5 | Chile | 3.33 | 2023 |
| 6 | Costa Rica | 2.69 | 2022 |
| 7 | Mexico | 2.59 | 2022 |
| 8 | Colombia | 2.54 | 2023 |
| 9 | Dominican Republic | 2.43 | 2023 |
| 10 | Brazil | 2.36 | 2023 |
| 11 | Ecuador | 2.31 | 2020 |
| 12 | Peru | 1.69 | 2023 |
| 13 | Venezuela | 1.66 | 2017 |
| 14 | Panama | 1.63 | 2022 |
| 15 | El Salvador | 1.62 | 2023 |
| 16 | Bolivia | 1.28 | 2021 |
| 17 | Guatemala | 1.28 | 2020 |
| 18 | Nicaragua | 0.68 | 2018 |
| 19 | Honduras | 0.49 | 2020 |
Source: WHO via the World Bank, indicator SH.MED.PHYS.ZS, last updated October 8, 2026, accessed November 9, 2026. Averages: Latin America and the Caribbean 2.57, OECD 3.43 and world 1.86, all for 2022.
View the data as a table
| Cuba | 9.54 |
| Argentina | 5.11 |
| Uruguay | 4.67 |
| Paraguay | 3.89 |
| Chile | 3.33 |
| Costa Rica | 2.69 |
| Mexico | 2.59 |
| Colombia | 2.54 |
| Dominican Republic | 2.43 |
| Brazil | 2.36 |
| Ecuador | 2.31 |
| Peru | 1.69 |
| Venezuela | 1.66 |
| Panama | 1.63 |
| El Salvador | 1.62 |
| Bolivia | 1.28 |
| Guatemala | 1.28 |
| Nicaragua | 0.68 |
| Honduras | 0.49 |
The map shows a Southern Cone with more doctors and a Central America with far fewer: Nicaragua (0.68, 2018) and Honduras (0.49, 2020) close the list, and Guatemala (1.28) and Bolivia (1.28) do not reach 1.3 either. Paraguay ranks fourth with an abrupt jump in its series, from 1.30 in 2020 to 3.89 in 2022, which probably reflects a change in record-keeping rather than a real increase in doctors in two years.
How the number of doctors per capita changed in Latin America
View the data as a table
| Argentina | Chile | Mexico | Colombia | Brazil | Peru | |
|---|---|---|---|---|---|---|
| 2010 | No data | 1.42 | 2.01 | 1.67 | No data | No data |
| 2012 | 4.82 | 1.74 | 2.12 | 1.81 | No data | 1.14 |
| 2014 | 4.92 | 2.02 | 2.24 | 1.96 | No data | No data |
| 2016 | 5.02 | 2.29 | 2.35 | 2.09 | No data | 1.31 |
| 2018 | 5.17 | 2.57 | 2.46 | 2.24 | No data | 1.37 |
| 2020 | 5.30 | 2.80 | 2.42 | 2.39 | No data | 1.44 |
| 2021 | 5.38 | 2.98 | 2.54 | 2.47 | 2.19 | 1.67 |
| 2022 | 5.44 | 3.18 | 2.59 | No data | No data | 1.65 |
| 2023 | 5.11 | 3.33 | No data | 2.54 | 2.36 | 1.69 |
Chile is the fastest-growing case in the region: it had 1.02 doctors per 1,000 people in 2009 and 3.33 in 2023, more than three times as many, according to the World Bank series. Colombia went from 1.67 to 2.54 over the same period, and Mexico from 2.01 in 2010 to 2.59 in 2022. Argentina, already high, rose from 4.82 in 2012 to 5.44 in 2022 before falling to 5.11 in 2023.
| Country | 2010 | 2015 | 2020 | Latest data |
|---|---|---|---|---|
| Chile | 1.42 | 2.14 | 2.80 | 3.33 (2023) |
| Argentina | n/a | 4.98 | 5.30 | 5.11 (2023) |
| Mexico | 2.01 | 2.34 | 2.42 | 2.59 (2022) |
| Colombia | 1.67 | 2.02 | 2.39 | 2.54 (2023) |
| Brazil | n/a | n/a | n/a | 2.36 (2023) |
| Peru | n/a | n/a | 1.44 | 1.69 (2023) |
Source: WHO via the World Bank, SH.MED.PHYS.ZS. "n/a": no data for that year. Brazil does not have data for every year in the series; Peru went from 1.14 in 2012 to 1.69 in 2023. What a doctor earns in Peru is covered in how much a doctor earns in Peru.

Doctors and health spending in Latin America
View the data as a table
| Health spending per person (US$) | Doctors per 1,000 people | |
|---|---|---|
| Cuba | 1,199.00 | 9.54 |
| Argentina | 1,457.00 | 5.11 |
| Uruguay | 2,076.00 | 4.67 |
| Paraguay | 527.00 | 3.89 |
| Chile | 1,760.00 | 3.33 |
| Costa Rica | 1,163.00 | 2.69 |
| Mexico | 761.00 | 2.59 |
| Colombia | 644.00 | 2.54 |
| Dominican Republic | 489.00 | 2.43 |
| Brazil | 1,010.00 | 2.36 |
| Ecuador | 509.00 | 2.31 |
| Peru | 446.00 | 1.69 |
| Venezuela | 186.00 | 1.66 |
| Panama | 1,558.00 | 1.63 |
| El Salvador | 501.00 | 1.62 |
| Bolivia | 255.00 | 1.28 |
| Guatemala | 392.00 | 1.28 |
| Nicaragua | 217.00 | 0.68 |
| Honduras | 249.00 | 0.49 |
Countries that spend more on health per person tend to have more doctors, but there are exceptions. Uruguay spends US$ 2,076 per person and has 4.67 doctors per 1,000; Chile spends US$ 1,760 and has 3.33. Cuba, with much lower spending in dollars, tops the list thanks to a system built on training doctors on a large scale. For full spending data, see health spending in Latin America.
Doctors, nursing and hospital beds in Latin America
The WHO uses a benchmark of 4.45 doctors, nurses and midwives per 1,000 people, the minimum it associates with basic health service coverage in its Global Strategy on Human Resources for Health. Adding up each country's doctors and nursing and midwifery staff, using the latest figure for each indicator, eight countries in the region fall below that line: Honduras (1.23), Nicaragua (2.25), Bolivia (2.90), Guatemala (3.55), Venezuela (3.66), El Salvador (3.80), Colombia (4.08) and Peru (4.43), according to Vivarae News' calculation with World Bank data. Since the years of each figure do not always match, the sum is an approximation.
| Cuba | 9.54 | 7.60 | 4.33 |
| Argentina | 5.11 | 4.75 | 3.36 |
| Uruguay | 4.67 | 7.39 | 2.44 |
| Paraguay | 3.89 | 9.41 | 1.04 |
| Chile | 3.33 | 5.45 | 1.94 |
| Costa Rica | 2.69 | 3.07 | 1.14 |
| Mexico | 2.59 | 3.03 | 1.01 |
| Colombia | 2.54 | 1.54 | 1.70 |
| Dominican Republic | 2.43 | 2.06 | 0.75 |
| Brazil | 2.36 | 5.50 | 2.52 |
| Ecuador | 2.31 | 2.51 | 1.32 |
| Peru | 1.69 | 2.74 | 1.56 |
| Venezuela | 1.66 | 2.00 | 0.99 |
| Panama | 1.63 | 3.35 | 1.95 |
| El Salvador | 1.62 | 2.18 | 1.21 |
| Bolivia | 1.28 | 1.62 | 1.49 |
| Guatemala | 1.28 | 2.27 | 0.45 |
| Nicaragua | 0.68 | 1.57 | 0.97 |
| Honduras | 0.49 | 0.74 | 0.53 |
Having many doctors does not guarantee a balanced system. Argentina has more doctors than nursing staff per person (5.11 versus 4.75), while in Paraguay the ratio is 9.41 nursing staff to 3.89 doctors. In hospital beds, Cuba (4.33) and Argentina (3.36) lead, and Chile has 1.94 per 1,000 people. Source: World Bank, SH.MED.NUMW.P3 and SH.MED.BEDS.ZS.
| Country | Doctors per 1,000 | Nursing per 1,000 | Doctors + nursing | Beds per 1,000 |
|---|---|---|---|---|
| Argentina | 5.11 | 4.75 | 9.86 | 3.36 |
| Chile | 3.33 | 5.45 | 8.78 | 1.94 |
| Mexico | 2.59 | 3.03 | 5.62 | 1.01 |
| Peru | 1.69 | 2.74 | 4.43 | 1.56 |
| Brazil | 2.36 | 5.50 | 7.86 | 2.52 |
| Colombia | 2.54 | 1.54 | 4.08 | 1.70 |

Other health indicators for the region are in the life expectancy ranking for Latin America and the infant mortality ranking.
How to cite this data
Vivarae News (2026). "Doctors per capita in Latin America: ranking by country 2026". Updated November 9, 2026. Available at https://vivaraenews.com/en/doctors-per-capita-in-latin-america-ranking-by-country-2026/. The data may be reproduced with credit to Vivarae News and a link to this page; each country's figures come from WHO health workforce statistics published by the World Bank.
Frequently asked questions
Which Latin American country has the most doctors per capita?
Cuba, with 9.5 doctors per 1,000 people in 2021. It is followed by Argentina (5.1) and Uruguay (4.7).
How many doctors per capita does Chile have?
3.33 per 1,000 people in 2023, fifth in the region and close to the OECD average (3.43).
How many doctors per capita does Peru have?
1.69 per 1,000 people in 2023, below the regional average of 2.57.
Which country in the region has the fewest doctors?
Honduras, with 0.49 per 1,000 people (2020), followed by Nicaragua (0.68, 2018).
Why are the data years different?
Because each country reports to the WHO at different intervals; the ranking uses each one's latest available figure.