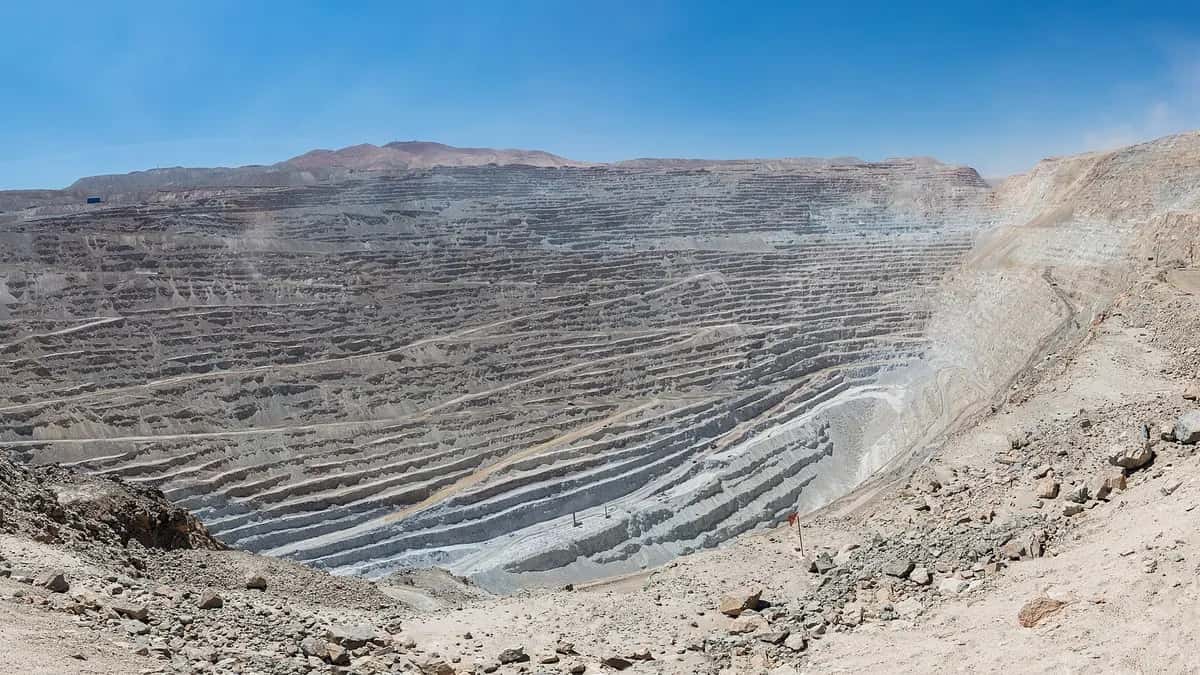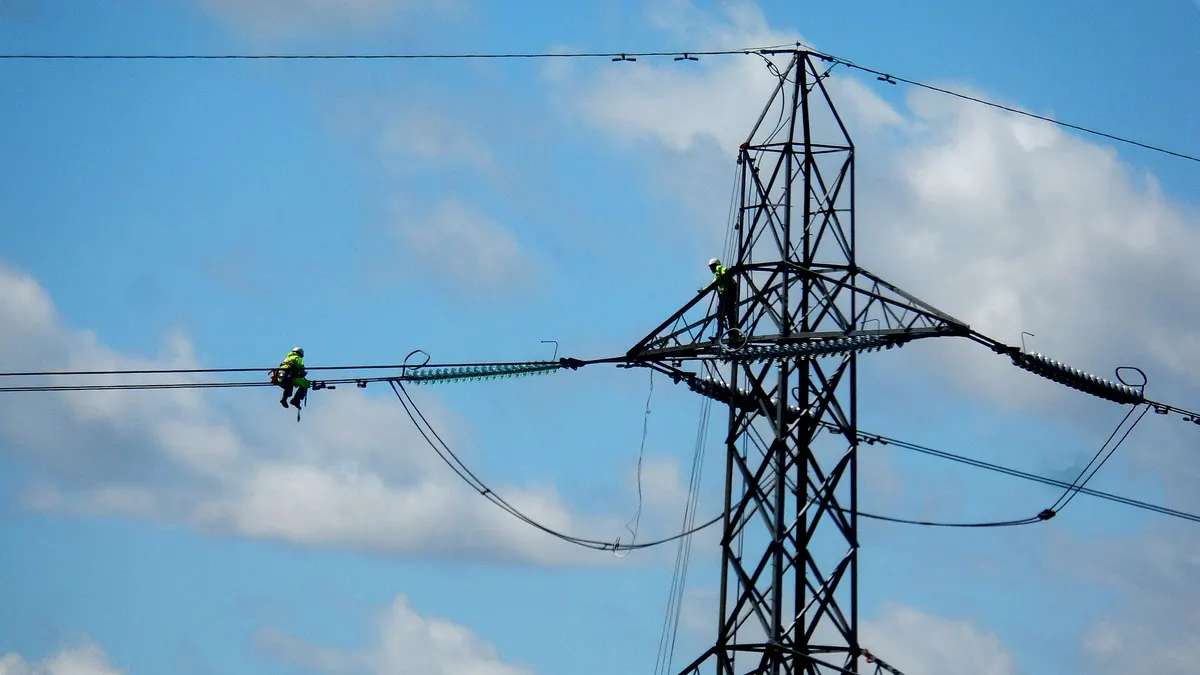
Argentina's industrial production fell 1.8% year on year in September 2026 and is down 2.6% in the first nine months of the year, while construction activity rose 5.1% from September 2025, according to the technical reports on the manufacturing production index (IPI) and the construction activity indicator (ISAC) released by INDEC on Friday, November 6. Compared with August, adjusted for seasonality, industry grew 0.7% and construction 7.8%.
The two indicators tell different stories. Industry has now posted three straight months of year-on-year declines and its trend-cycle series has been falling since May, with farm machinery, home appliances and electronics the hardest-hit segments. Construction, by contrast, bounced back after two negative months and is up 1.3% for the year. This article brings together the official figures, the 16 manufacturing divisions and construction materials.
Industry and construction in September according to INDEC, in figures
View the data as a table
| Industry, year on year | -1.8% |
| Industry, year to date | -2.6% |
| Construction, year on year | 5.1% |
| Construction, year to date | 1.3% |
| Indicator (September 2026) | Industry (IPI) | Construction (ISAC) |
|---|---|---|
| Year-on-year change | −1.8% | +5.1% |
| Seasonally adjusted monthly change | +0.7% | +7.8% |
| January-September cumulative | −2.6% | +1.3% |
| Trend-cycle, vs. previous month | −0.4% | Close to zero |
| Original-series index (base 2004 = 100) | 122.4 | 168.7 |
Source: INDEC, IPI and ISAC, September 2026. Some outlets mixed up the figures: construction's 7.8% is the monthly change and 5.1% the annual one; for industry, +0.7% is monthly and −1.8% annual.
Argentina's industry month by month: three annual declines in a row
View the data as a table
| Construction (ISAC) | Industry (IPI) | |
|---|---|---|
| Jan 25 | -1.4% | 7.4% |
| Feb 25 | 4.0% | 5.9% |
| Mar 25 | 15.4% | 5.1% |
| Apr 25 | 26.5% | 9.0% |
| May 25 | 9.3% | 6.1% |
| Jun 25 | 13.9% | 9.5% |
| Jul 25 | 1.9% | -0.9% |
| Aug 25 | 0.0% | -4.4% |
| Sep 25 | 6.7% | -0.5% |
| Oct 25 | 8.2% | -3.0% |
| Nov 25 | -4.6% | -9.0% |
| Dec 25 | 2.9% | -4.3% |
| Jan 26 | 0.4% | -3.9% |
| Feb 26 | -1.5% | -8.8% |
| Mar 26 | 12.5% | 5.0% |
| Apr 26 | -3.0% | -2.5% |
| May 26 | 4.1% | -5.7% |
| Jun 26 | 4.2% | 2.0% |
| Jul 26 | -4.5% | -5.0% |
| Aug 26 | -4.4% | -3.1% |
| Sep 26 | 5.1% | -1.8% |
In 2026 industry has had only two months with year-on-year growth: March (+5.0%) and June (+2.0%). July (−5.0%), August (−3.1%) and September (−1.8%) were negative, although the decline eased. In the seasonally adjusted series, the index rose from 111.7 in July, its low for the period, to 115.1 in September.
View the data as a table
| Construction (ISAC) | Industry (IPI) | |
|---|---|---|
| Jan 25 | 141.7 | 120.6 |
| Feb 25 | 146.4 | 123.5 |
| Mar 25 | 138.3 | 116.5 |
| Apr 25 | 148.0 | 119.4 |
| May 25 | 144.1 | 121.1 |
| Jun 25 | 145.2 | 119.1 |
| Jul 25 | 147.2 | 117.9 |
| Aug 25 | 145.8 | 118.5 |
| Sep 25 | 145.6 | 117.7 |
| Oct 25 | 146.4 | 117.0 |
| Nov 25 | 140.2 | 115.7 |
| Dec 25 | 145.5 | 115.9 |
| Jan 26 | 145.8 | 118.5 |
| Feb 26 | 144.2 | 114.8 |
| Mar 26 | 149.5 | 119.3 |
| Apr 26 | 144.8 | 117.1 |
| May 26 | 153.4 | 117.2 |
| Jun 26 | 145.9 | 118.1 |
| Jul 26 | 140.4 | 111.7 |
| Aug 26 | 141.8 | 114.2 |
| Sep 26 | 153.0 | 115.1 |
| Month of 2026 | Industry, y/y | Construction, y/y |
|---|---|---|
| January | -3.9% | +0.4% |
| February | -8.8% | -1.5% |
| March | +5.0% | +12.5% |
| April | -2.5% | -3.0% |
| May | -5.7% | +4.1% |
| June | +2.0% | +4.2% |
| July | -5.0% | -4.5% |
| August | -3.1% | -4.4% |
| September | -1.8% | +5.1% |
Source: INDEC, table 1 of each report. For the rest of the economy, see economic activity in August.
Which manufacturing divisions fell and which rose
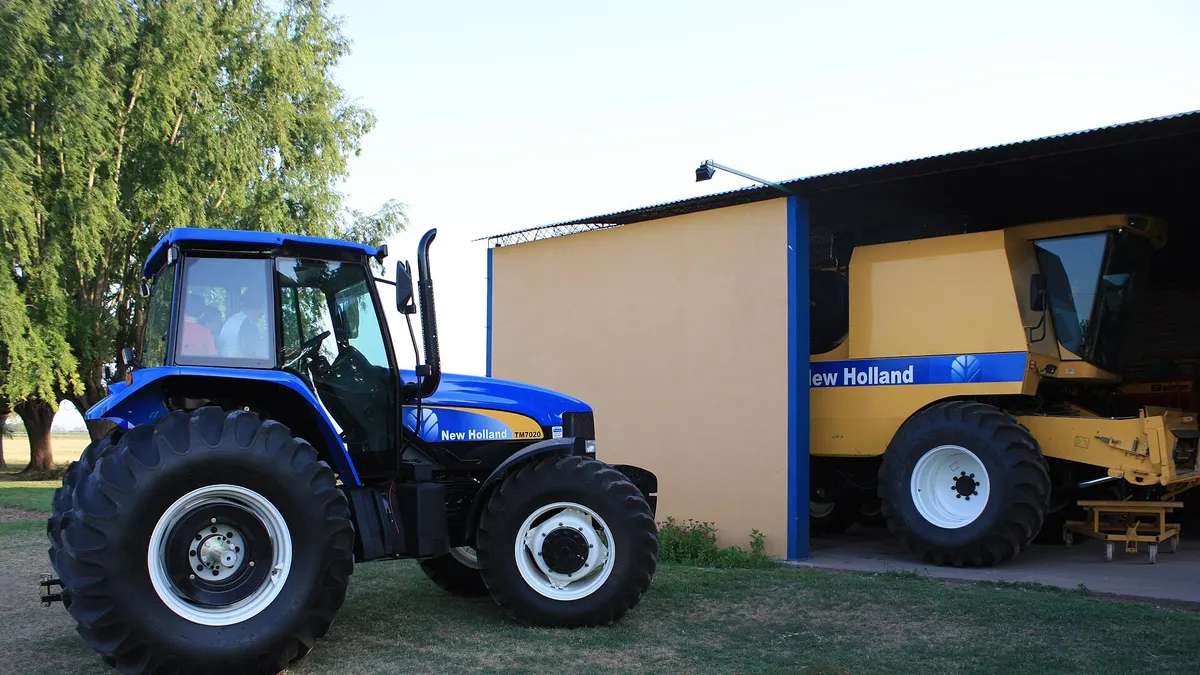
Of the 16 manufacturing divisions, 10 declined from September 2025. The biggest drop was in machinery and equipment (−26.8%), which took 1.6 points off the headline index. Within it, farm machinery plunged 45.4% on lower production and sales of tractors, combines, seeders and self-propelled sprayers, and household appliances fell 23.6% on fewer refrigerators, freezers and washing machines. Next came other equipment and instruments (−22.0%), with consumer electronics (phones and TVs) down 38.9%.
At the other end, other transport equipment (+11.0%), wood, paper, publishing and printing (+6.4%), non-metallic minerals (+5.1%) and chemicals (+3.9%) rose, the latter adding the most to the index (0.6 points). Motor vehicles fell 11.9%; according to carmakers' association ADEFA, cited by INDEC, sales of domestically made cars to dealers dropped 28.3%, although vehicle exports rose 6.8%.
| Division | Year on year | 2026 to date |
|---|---|---|
| Machinery and equipment | -26.8% | -21.6% |
| Other equipment and instruments | -22.0% | -19.6% |
| Tobacco products | -6.5% | +1.5% |
| Apparel, leather and footwear | -5.3% | -13.4% |
| Furniture and other industries | -4.9% | -4.9% |
| Metal products | -4.0% | -2.9% |
Source: INDEC, table 3 of the IPI. The six divisions with the worst annual change.
Food, cars and textiles: the detail of Argentina's industry in September
Industry's largest division, food and beverages, was practically flat (−0.1% year on year). Within it, other food products fell 10.8% because of a smaller shrimp catch: the fishing season in national waters ended in mid-September, whereas in 2025 it lasted the whole month, the INDEC report explains. Textiles rose 2.0% in the month but are down 18.6% for the year, the worst cumulative figure of any division, and apparel, leather and footwear fell 5.3%; according to sources consulted by INDEC, manufacturers face weaker domestic demand and more competition from imports.
| Segment | Year on year | What INDEC says |
|---|---|---|
| Farm machinery | −45.4% | Lower output and sales of tractors, combines and seeders |
| Electronics (phones and TVs) | −38.9% | Fewer units sold |
| Household appliances | −23.6% | Fewer refrigerators, freezers and washing machines |
| Motor vehicles | −11.9% | Domestic car sales to dealers: −28.3% (ADEFA) |
| Other food products | −10.8% | Early end of the shrimp season |
| Apparel | −6.4% | Weaker domestic demand and import competition |
Source: INDEC, sector analysis in the September 2026 IPI report.
Construction in September: which materials rose
The ISAC measures construction activity through the apparent consumption of 13 materials. In September seven rose, led by construction paints (+22.4%) and ready-mix concrete (+12.8%), and six fell, with terrazzo and cement tiles (−15.0%) posting the biggest drop. Portland cement, the most closely watched input, rose 4.6% year on year, although it is down 2.9% for the year.
| Material | September, y/y | Jan-Sep cumulative |
|---|---|---|
| Construction paints | +22.4% | +10.4% |
| Ready-mix concrete | +12.8% | +2.3% |
| Other (taps, seamless pipes, glass) | +12.2% | +21.8% |
| Rebar and steel | +5.2% | +3.1% |
| Portland cement | +4.6% | -2.9% |
| Plasterboard | +1.2% | +0.9% |
| Asphalt | +0.5% | -8.9% |
| Lime | -0.2% | -5.1% |
| Hollow bricks | -0.7% | -5.3% |
| Ceramic floor and wall tiles | -7.4% | -9.3% |
| Gypsum | -7.7% | -11.6% |
| Ceramic sanitary ware | -8.2% | +2.9% |
| Terrazzo and cement tiles | -15.0% | -7.5% |
Source: INDEC, table 2 of the ISAC. The same report includes two August figures: registered private-sector construction jobs reached 382,669, up 1.7% from a year earlier, and the floor area authorized by building permits in 246 municipalities fell 10.9% year on year to 1,292,308 m², although it is up 4.8% over eight months. For employment in the rest of the economy, see registered private employment.
| Construction indicator (August 2026) | Value | Year on year | Year to date |
|---|---|---|---|
| Registered private-sector jobs | 382,669 | +1.7% | +0.8% (Jan-Aug) |
| Floor area authorized by permits (246 municipalities) | 1,292,308 m² | −10.9% | +4.8% (Jan-Aug) |
Source: INDEC, tables 3 and 4 of the ISAC. These two indicators come out with a one-month lag relative to the main index.
Frequently asked questions
How much did Argentina's industry fall in September 2026?
INDEC's manufacturing index fell 1.8% year on year and rose 0.7% from August in the seasonally adjusted series. It is down 2.6% for January-September.
How much did construction grow in September 2026?
The ISAC rose 5.1% year on year and 7.8% from August in the seasonally adjusted series. It is up 1.3% for the year.
Which industrial sector fell the most?
Machinery and equipment, down 26.8% year on year. Farm machinery fell 45.4%.
Which construction material rose the most?
Construction paints, up 22.4% year on year, followed by ready-mix concrete (+12.8%).
How many people work in construction in Argentina?
In August 2026 there were 382,669 registered private-sector construction jobs, 1.7% more than a year earlier, according to INDEC's ISAC report.