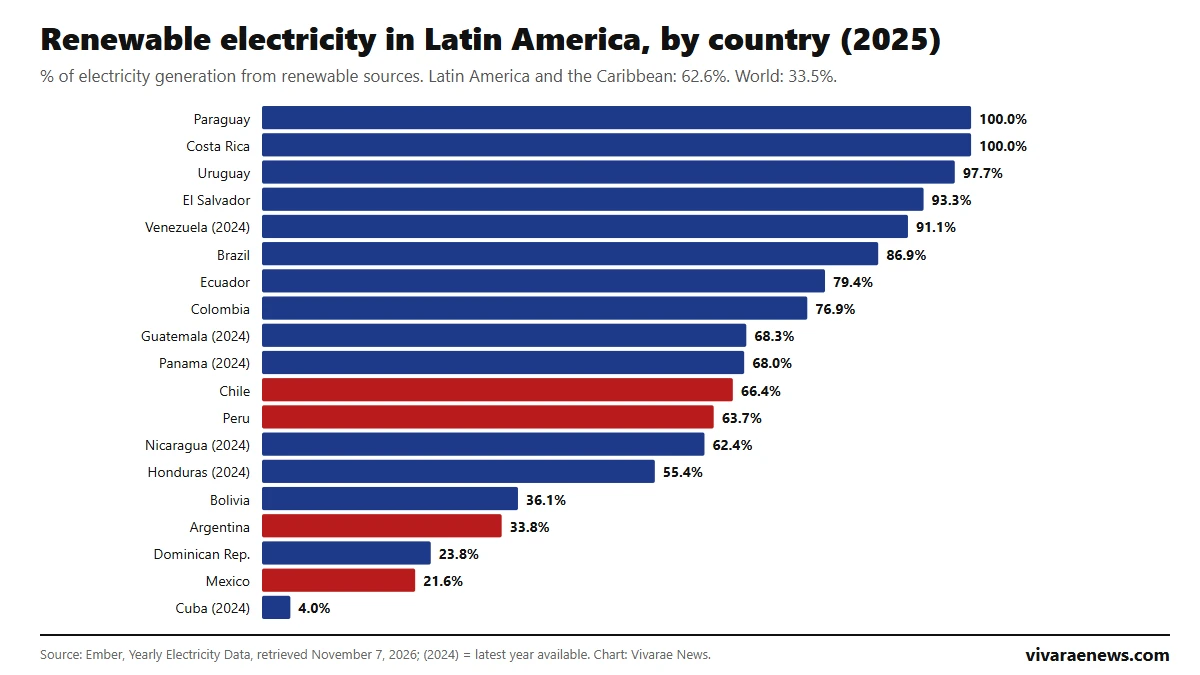
Latin America and the Caribbean generated 62.6% of its electricity from renewable sources in 2025, almost double the world average (33.5%), according to Ember's yearly electricity data. Paraguay tops the ranking at 100%, followed by Costa Rica (99.99%), Uruguay (97.7%), El Salvador (93.3%) and Venezuela (91.1%, 2024 data). At the other end are Cuba (4.0%), Mexico (21.6%) and the Dominican Republic (23.8%).
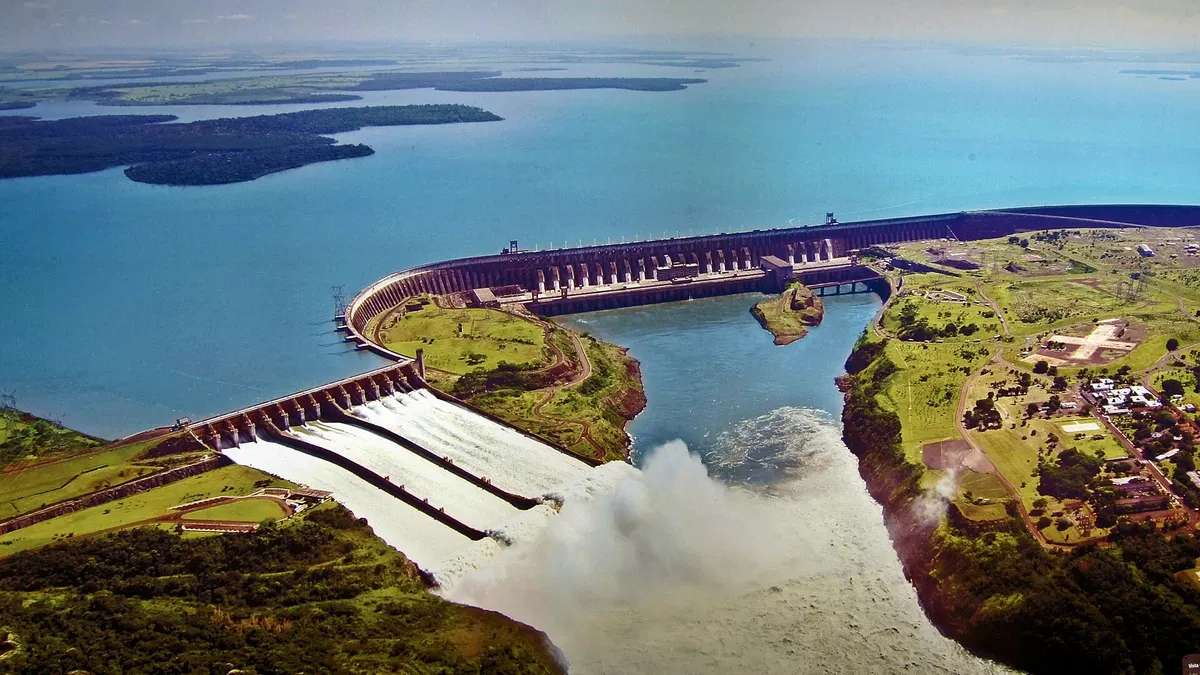
The region has a historical advantage: large dams such as Itaipú and Guri mean hydropower provides 39.5% of generation. What is new is the jump in wind and solar, which together already account for 18.0%. Since 2015, the region's renewable share has risen 12.0 points. This ranking covers 19 countries with the latest data available and compares electricity with total energy consumption, where renewables weigh much less.
View the data as a table
| Latin America and the Caribbean | 62.6% |
| World average | 33.5% |
| Paraguay | 100% |
| Cuba | 4.0% |
Renewable energy in Latin America ranking by country (2025)
View the data as a table
| Paraguay | 100.0% · Hydro 99.5%, wind 0.0%, solar 0.0% |
| Costa Rica | 100.0% · Hydro 74.9%, wind 12.0%, solar 0.8% |
| Uruguay | 97.7% · Hydro 27.3%, wind 40.5%, solar 5.2% |
| El Salvador | 93.3% · Hydro 32.1%, wind 2.7%, solar 22.3% |
| Venezuela | 91.1% · Hydro 91.1%, wind 0.0%, solar 0.0% (2024 data) |
| Brazil | 86.9% · Hydro 52.1%, wind 15.2%, solar 11.5% |
| Ecuador | 79.4% · Hydro 78.0%, wind 0.5%, solar 0.1% |
| Colombia | 76.9% · Hydro 69.1%, wind 0.2%, solar 5.1% |
| Guatemala | 68.3% · Hydro 39.9%, wind 2.3%, solar 1.8% (2024 data) |
| Panama | 68.0% · Hydro 53.1%, wind 7.1%, solar 7.4% (2024 data) |
| Chile | 66.4% · Hydro 22.2%, wind 13.1%, solar 25.1% |
| Peru | 63.7% · Hydro 56.0%, wind 3.5%, solar 3.1% |
| Nicaragua | 62.4% · Hydro 14.4%, wind 12.4%, solar 0.7% (2024 data) |
| Honduras | 55.4% · Hydro 30.4%, wind 6.0%, solar 9.5% (2024 data) |
| Bolivia | 36.1% · Hydro 27.9%, wind 2.0%, solar 3.0% |
| Argentina | 33.8% · Hydro 16.3%, wind 12.2%, solar 3.4% |
| Dominican Republic | 23.8% · Hydro 6.8%, wind 6.2%, solar 10.0% |
| Mexico | 21.6% · Hydro 7.5%, wind 5.6%, solar 7.0% |
| Cuba | 4.0% · Hydro 0.6%, wind 0.4%, solar 1.2% (2024 data) |
| Rank | Country | Renewable electricity | In 2015 | Data year |
|---|---|---|---|---|
| 1 | Paraguay | 100.0% | 100.0% | 2025 |
| 2 | Costa Rica | 99.99% | 99.0% | 2025 |
| 3 | Uruguay | 97.7% | 93.2% | 2025 |
| 4 | El Salvador | 93.3% | 58.3% | 2025 |
| 5 | Venezuela | 91.1% | 58.8% | 2024 |
| 6 | Brazil | 86.9% | 74.2% | 2025 |
| 7 | Ecuador | 79.4% | 51.1% | 2025 |
| 8 | Colombia | 76.9% | 63.3% | 2025 |
| 9 | Guatemala | 68.3% | 61.1% | 2024 |
| 10 | Panama | 68.0% | 65.3% | 2024 |
| 11 | Chile | 66.4% | 43.2% | 2025 |
| 12 | Peru | 63.7% | 52.7% | 2025 |
| 13 | Nicaragua | 62.4% | 50.1% | 2024 |
| 14 | Honduras | 55.4% | 44.1% | 2024 |
| 15 | Bolivia | 36.1% | 29.4% | 2025 |
| 16 | Argentina | 33.8% | 23.7% | 2025 |
| 17 | Dominican Republic | 23.8% | 7.9% | 2025 |
| 18 | Mexico | 21.6% | 15.3% | 2025 |
| 19 | Cuba | 4.0% | 4.4% | 2024 |
Source: Ember, Yearly Electricity Data, retrieved November 7, 2026. Latest year available: 2025 (2024 for Cuba, Guatemala, Honduras, Nicaragua, Panama and Venezuela). The figure measures the share of renewable sources (hydro, wind, solar, bioenergy and geothermal) in each country's electricity generation. Ember does not publish separate data for Haiti.
Where each country's renewable energy comes from
Similar percentages hide very different mixes. Paraguay, Venezuela, Ecuador and Colombia rely almost entirely on water, which leaves them exposed to droughts. Uruguay is the most diversified case: wind supplies 40.5% of its electricity, more than hydro (27.3%), and bioenergy another 24.7%. Chile is the country in the region where solar weighs the most (25.1%), and El Salvador combines hydro, solar (22.3%) and geothermal. Costa Rica and Nicaragua also use geothermal power, which Ember includes in "other renewables."
View the data as a table
| Hydro | Wind | Solar | Bioenergy and other | Fossil and nuclear | |
|---|---|---|---|---|---|
| Paraguay | 99.5 | 0.0 | 0.0 | 0.5 | 0.0 |
| Costa Rica | 74.9 | 12.0 | 0.8 | 12.3 | 0.0 |
| Uruguay | 27.3 | 40.5 | 5.2 | 24.7 | 2.3 |
| El Salvador | 32.1 | 2.7 | 22.3 | 36.3 | 6.7 |
| Venezuela | 91.1 | 0.0 | 0.0 | 0.0 | 8.9 |
| Brazil | 52.1 | 15.2 | 11.5 | 8.1 | 13.1 |
| Ecuador | 78.0 | 0.5 | 0.1 | 0.8 | 20.6 |
| Colombia | 69.1 | 0.2 | 5.1 | 2.6 | 23.1 |
| Guatemala | 39.9 | 2.3 | 1.8 | 24.4 | 31.7 |
| Panama | 53.1 | 7.1 | 7.4 | 0.4 | 32.0 |
| Chile | 22.2 | 13.1 | 25.1 | 6.0 | 33.6 |
| Peru | 56.0 | 3.5 | 3.1 | 1.1 | 36.3 |
| Nicaragua | 14.4 | 12.4 | 0.7 | 35.0 | 37.6 |
| Honduras | 30.4 | 6.0 | 9.5 | 9.5 | 44.6 |
| Bolivia | 27.9 | 2.0 | 3.0 | 3.2 | 63.9 |
| Argentina | 16.3 | 12.2 | 3.4 | 2.0 | 66.2 |
| Dominican Republic | 6.8 | 6.2 | 10.0 | 0.8 | 76.2 |
| Mexico | 7.5 | 5.6 | 7.0 | 1.5 | 78.4 |
| Cuba | 0.6 | 0.4 | 1.2 | 1.8 | 96.0 |
| Country | Hydro | Wind | Solar | Bioenergy and other |
|---|---|---|---|---|
| Paraguay | 99.5% | 0.0% | 0.0% | 0.5% |
| Costa Rica | 74.9% | 12.0% | 0.8% | 12.3% |
| Uruguay | 27.3% | 40.5% | 5.2% | 24.7% |
| El Salvador | 32.1% | 2.7% | 22.3% | 36.3% |
| Venezuela | 91.1% | 0.0% | 0.0% | 0.0% |
| Brazil | 52.1% | 15.2% | 11.5% | 8.1% |
| Ecuador | 78.0% | 0.5% | 0.1% | 0.8% |
| Colombia | 69.1% | 0.2% | 5.1% | 2.6% |
| Guatemala | 39.9% | 2.3% | 1.8% | 24.4% |
| Panama | 53.1% | 7.1% | 7.4% | 0.4% |
| Chile | 22.2% | 13.1% | 25.1% | 6.0% |
| Peru | 56.0% | 3.5% | 3.1% | 1.1% |
Source: Ember, Yearly Electricity Data, retrieved November 7, 2026. Latest year available: 2025 (2024 for Cuba, Guatemala, Honduras, Nicaragua, Panama and Venezuela). The top 12 in the ranking.
Latin American countries with the most wind and solar power
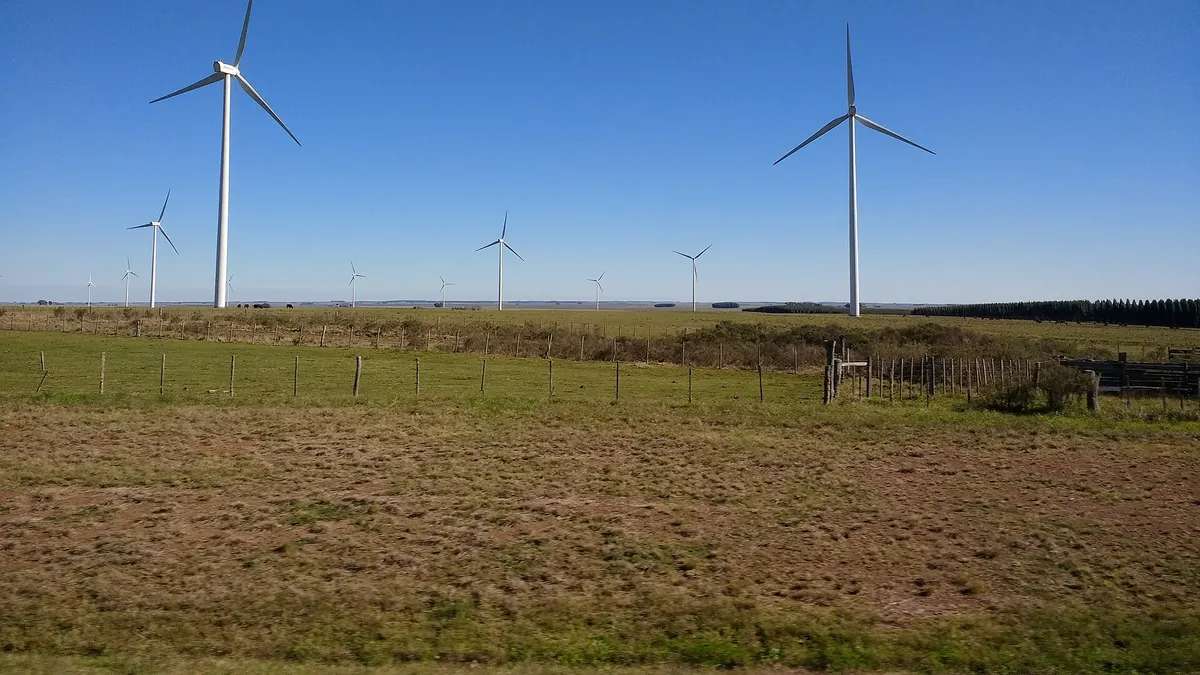
Looking only at the sources growing fastest worldwide, wind and sun, the ranking changes completely. Uruguay leads with 45.7% of its electricity from wind and solar, followed by Chile (38.1%), Brazil (26.7%), El Salvador (25.0%) and the Dominican Republic (16.2%). Countries at the top of the overall ranking, such as Paraguay, Venezuela and Ecuador, have almost no wind or solar because their grids rely on large dams. On the regional average, wind and solar add up to 18.0%, slightly above the world's 17.3%.
| Country | Wind + solar | Wind | Solar |
|---|---|---|---|
| Uruguay | 45.7% | 40.5% | 5.2% |
| Chile | 38.1% | 13.1% | 25.1% |
| Brazil | 26.7% | 15.2% | 11.5% |
| El Salvador | 25.0% | 2.7% | 22.3% |
| Dominican Republic | 16.2% | 6.2% | 10.0% |
| Honduras | 15.5% | 6.0% | 9.5% |
| Argentina | 15.5% | 12.2% | 3.4% |
| Panama | 14.5% | 7.1% | 7.4% |
Source: Ember, Yearly Electricity Data, retrieved November 7, 2026. Latest year available: 2025 (2024 for Cuba, Guatemala, Honduras, Nicaragua, Panama and Venezuela).
How renewable energy in Latin America has changed since 2015
The Dominican Republic made the most progress in relative terms: it went from 7.9% in 2015 to 23.8% in 2025 thanks to solar and wind. Chile rose from 43.2% to 66.4% (it reached 70.0% in 2024), El Salvador from 58.3% to 93.3% and Ecuador from 51.1% to 79.4%. Mexico advanced little: from 15.3% to 21.6%, with a setback in 2023. Argentina went from 23.7% to 33.8%, driven by wind, which now supplies 12.2% of its electricity.
View the data as a table
| Brazil | Chile | Peru | Latin America and the Caribbean | Argentina | Mexico | |
|---|---|---|---|---|---|---|
| 2015 | 74.2% | 43.2% | 52.7% | 50.6% | 23.7% | 15.3% |
| 2016 | 80.5% | 42.9% | 50.4% | 52.5% | 21.4% | 15.6% |
| 2017 | 79.2% | 43.5% | 58.6% | 54.2% | 23.1% | 15.6% |
| 2018 | 82.4% | 45.9% | 61.1% | 55.6% | 24.0% | 16.4% |
| 2019 | 81.4% | 46.2% | 60.5% | 55.0% | 24.9% | 16.6% |
| 2020 | 83.2% | 48.4% | 63.5% | 57.4% | 25.3% | 19.8% |
| 2021 | 77.4% | 48.9% | 61.6% | 56.5% | 24.2% | 23.1% |
| 2022 | 87.7% | 55.3% | 55.2% | 61.1% | 29.0% | 22.7% |
| 2023 | 89.0% | 63.1% | 54.4% | 61.2% | 34.8% | 18.6% |
| 2024 | 88.1% | 70.0% | 60.1% | 61.9% | 34.1% | 19.7% |
| 2025 | 86.9% | 66.4% | 63.7% | 62.6% | 33.8% | 21.6% |
Electricity is not all energy
A country can have an almost 100% renewable grid and still depend on oil, because transport, industry and heating run on fuels. The World Bank measures the share of renewables in final consumption of all energy: in 2021, the latest year published, Guatemala (62.1%), Paraguay (58.8%) and Uruguay (57.8%) led the region, while Costa Rica, with its almost entirely clean grid, reached 34.2%. Chile had 24.2%, Mexico 13.0% and Argentina 9.2%, according to indicator EG.FEC.RNEW.ZS.
View the data as a table
| Renewable % of electricity (2025) | Renewable % of final energy consumption (2021) | |
|---|---|---|
| Paraguay | 100.0% | 58.8% |
| Costa Rica | 100.0% | 34.2% |
| Uruguay | 97.7% | 57.8% |
| El Salvador | 93.3% | 21.9% |
| Venezuela | 91.1% | 33.7% |
| Brazil | 86.9% | 46.5% |
| Ecuador | 79.4% | 18.9% |
| Colombia | 76.9% | 29.7% |
| Guatemala | 68.3% | 62.1% |
| Panama | 68.0% | 28.0% |
| Chile | 66.4% | 24.2% |
| Peru | 63.7% | 30.6% |
| Nicaragua | 62.4% | 50.4% |
| Honduras | 55.4% | 45.9% |
| Bolivia | 36.1% | 12.8% |
| Argentina | 33.8% | 9.2% |
| Dominican Republic | 23.8% | 14.8% |
| Mexico | 21.6% | 13.0% |
| Cuba | 4.0% | 20.9% |
| Country | Renewable electricity (2025) | Renewable final energy (2021) |
|---|---|---|
| Paraguay | 100.0% | 58.8% |
| Costa Rica | 100.0% | 34.2% |
| Uruguay | 97.7% | 57.8% |
| Brazil | 86.9% | 46.5% |
| Colombia | 76.9% | 29.7% |
| Chile | 66.4% | 24.2% |
| Peru | 63.7% | 30.6% |
| Argentina | 33.8% | 9.2% |
| Mexico | 21.6% | 13.0% |
| Paraguay | 100.0% | 99.5% | 0.0% | 0.0% | 0.0% | 2025 |
| Costa Rica | 100.0% | 74.9% | 12.0% | 0.8% | 0.0% | 2025 |
| Uruguay | 97.7% | 27.3% | 40.5% | 5.2% | 2.3% | 2025 |
| El Salvador | 93.3% | 32.1% | 2.7% | 22.3% | 6.7% | 2025 |
| Venezuela | 91.1% | 91.1% | 0.0% | 0.0% | 8.9% | 2024 |
| Brazil | 86.9% | 52.1% | 15.2% | 11.5% | 11.1% | 2025 |
| Ecuador | 79.4% | 78.0% | 0.5% | 0.1% | 20.6% | 2025 |
| Colombia | 76.9% | 69.1% | 0.2% | 5.1% | 23.1% | 2025 |
| Guatemala | 68.3% | 39.9% | 2.3% | 1.8% | 31.7% | 2024 |
| Panama | 68.0% | 53.1% | 7.1% | 7.4% | 32.0% | 2024 |
| Chile | 66.4% | 22.2% | 13.1% | 25.1% | 33.6% | 2025 |
| Peru | 63.7% | 56.0% | 3.5% | 3.1% | 36.3% | 2025 |
| Nicaragua | 62.4% | 14.4% | 12.4% | 0.7% | 37.6% | 2024 |
| Honduras | 55.4% | 30.4% | 6.0% | 9.5% | 44.6% | 2024 |
| Bolivia | 36.1% | 27.9% | 2.0% | 3.0% | 63.9% | 2025 |
| Argentina | 33.8% | 16.3% | 12.2% | 3.4% | 59.1% | 2025 |
| Dominican Republic | 23.8% | 6.8% | 6.2% | 10.0% | 76.2% | 2025 |
| Mexico | 21.6% | 7.5% | 5.6% | 7.0% | 75.8% | 2025 |
| Cuba | 4.0% | 0.6% | 0.4% | 1.2% | 96.0% | 2024 |
For another look at the region's environmental footprint, see CO2 emissions per person in Latin America.
How to cite this data
Vivarae News (2026). "Renewable energy in Latin America: ranking by country 2026". Updated November 7, 2026. https://vivaraenews.com/en/renewable-energy-in-latin-america-ranking-by-country-2026/ Data: Ember, Yearly Electricity Data (renewable share of electricity generation, 2025 or latest year) and World Bank, EG.FEC.RNEW.ZS (2021). This ranking is updated at this same URL when Ember releases new data.
Frequently asked questions
Which Latin American country has the most renewable energy?
Paraguay, which generates 100% of its electricity from renewable sources, almost all of it hydropower. It is followed by Costa Rica (99.99%) and Uruguay (97.7%), according to Ember.
What share of Latin America's electricity is renewable?
62.6% in 2025, compared with a 33.5% world average, according to Ember.
What share of renewable energy does Chile have?
66.4% of its electricity in 2025 (70.0% in 2024). Solar provides 25.1%, the largest share in the region.
And Mexico?
21.6% of its electricity in 2025, one of the lowest levels in the region, behind the Dominican Republic (23.8%) and ahead only of Cuba (4.0%).
Why is the World Bank figure lower?
Because it measures renewables in final consumption of all energy, including transport and industry, not just electricity. Its latest year published is 2021.